
PLS! Help me by checking my writing task 1_ Mixed (REWRITE)
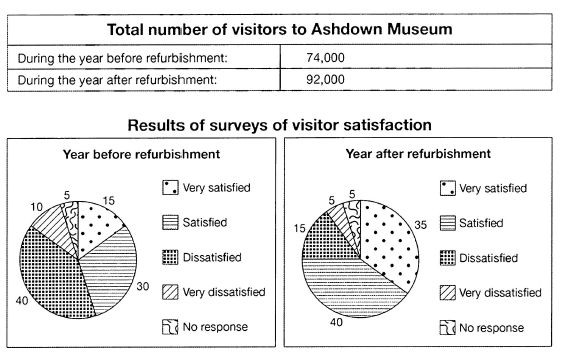
The table below shows the numbers of visitors to Ashdown Museum during the year before and the year after it was refurbished. The charts show the result of surveys asking visitors who satisfied they were with their visit, during the same two periods.
Summarise the information by selecting and reporting the main features and make comparison where relevant.
My essay:
The table shows the total number of visitors who went to visit Ashdown Museum during the year before and after refurbishment. The pie charts compare satisfaction levels of tourists when they visited Ashdown Museum.
Overall, the number of visitors to Ashdown Museum have an increasing. In pie charts, the number of visitors who were extremely satisfied and satisfied increase quickly, while other who were dissatisfied or very dissatisfied went down.
During the year before refurbishment, 74000 people paid visit to Ashdown Museum . After refurbishment, the number of visitors to Ashdown Museum went up enormously, at 92000 people. It increased by 18000 people.
Tourists who were highly satisfied took up 15% when they went to Ashdown Museum before refurbishment. This proportion increased at 35% during the year after refurbishment. The proportion of visitors who answered that they are satisfied increased from 30 % to 40%. In contrast, during the year after refurbishment, the proportion of tourists who were dissatisfied and extremely dissatisfied went down. It decreased to 15% and 5% respectively. It went down significantly. Visitors who had no response remained stable at 5%.
Top answer
Your writing still implies a line graph, not discrete measurement points in time. Here is a model essay: The table and two pie charts together show the effect of a refurbishment project at the Ashdown Museum on both the numbers of visitors and their satisfaction levels. In particular, the table shows the numbers of attendees in the year before and the year after the project.
- Your writing still implies a line graph, not discrete measurement points in time.
- Here is a model essay: The table and two pie charts together show the effect of a refurbishment project at the Ashdown Museum on both the numbers of visitors and their satisfaction levels.
- In particular, the table shows the numbers of attendees in the year before and the year after the project.
- The two pie charts show the results of satisfaction surveys in those same time periods.
- The satisfaction levels shown on the charts are: very satisfied, satisfied, dissatisfied and very dissatisfied.
Get the Weekly English Kit 📬
New words, one handy idiom, and a 2-minute quiz — delivered to your inbox to keep your streak alive.
Your writing still implies a line graph, not discrete measurement points in time.
Here is a model essay:
The table and two pie charts together show the effect of a refurbishment project at the Ashdown Museum on both the numbers of visitors and their satisfaction levels. In particular, the table shows the numbers of attendees in the year before and the year after the project. The
The table shows the total number of visitors who went to visit Ashdown Museum during the year before and after refurbishment. The pie charts compare satisfaction levels of tourists when they visited Ashdown Museum.
Overall, the number of visitors to Ashdown Museum have an increasing. (It is wrong to use the present participle. That is onl
 Related Questions