
PLS!! Help me by checking my writing task 1 _ marriages and divorces
TOPIC: The graph shows the number of marriages and divorces in the UK between 1975 and 2000.
My essay:
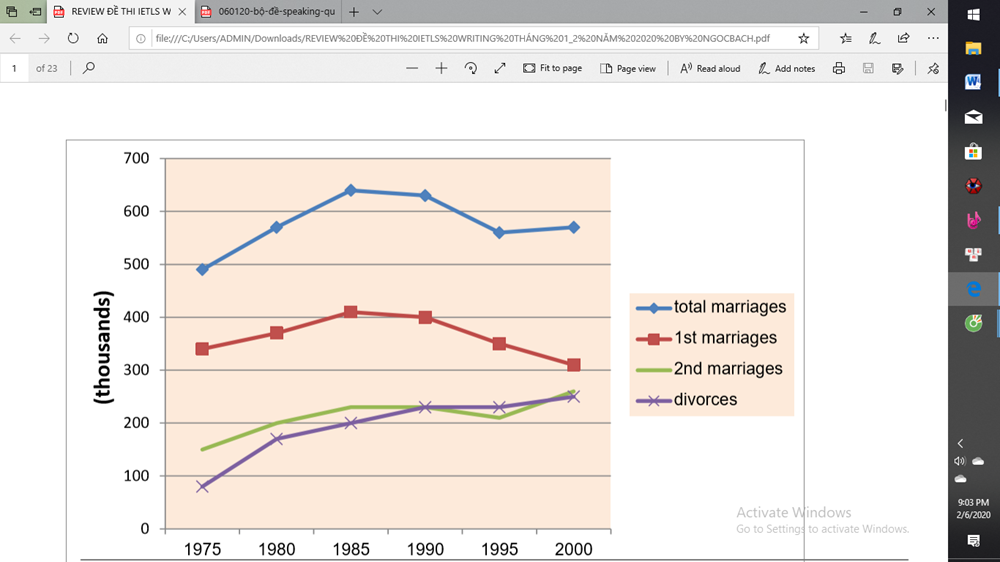
The line graph compares the number of marriages and divorces in the UK over a period of 25 years.
Overall, there were increases in the number of total marriages, divorces, and second marriages, while the number of first marriages declined.
In 1975, the total marriages were 500 thousand, while the number of first marriages was approximately 350 thousand. From 1975 to 2000, the number of total marriages increased to about 620 thousand, but the opposite was true for the first marriages. The number of the first marriages decreased by approximately 20 thousand over the period shown.
In comparison, the lowest figure was recorded in divorces, with about 90 thousand in 1975. During the period from 1975 to 2000, the number of divorces rose to about 250 thousand. After a slight decrease in 1995, second marriages increased to approximately 260 thousand at the end of the period.
Top answer
You need to describe what happened in the middle of the red and blue graphs.
- You need to describe what happened in the middle of the red and blue graphs.
Get the Weekly English Kit 📬
New words, one handy idiom, and a 2-minute quiz — delivered to your inbox to keep your streak alive.
You need to describe what happened in the middle of the red and blue graphs.
 Related Questions