
Pls!!! Help me by checking my writing task 1_ line graph
The graph below shows the quantities of goods transported in the UK between 1974 and 2002 by four different modes of transport.
Summarise the information by selecting and reporting the main features, and make comparisons where relevant.
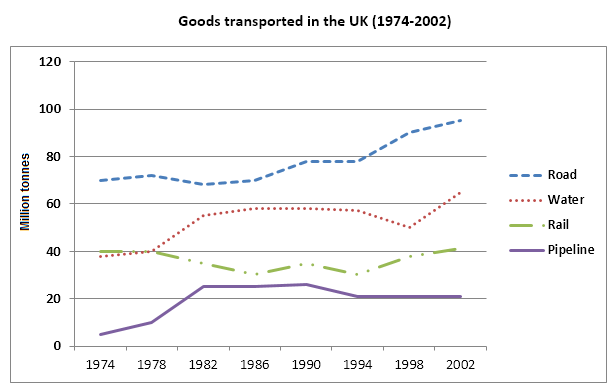
The line graph compares the amounts of goods delivered by four means of transport, namely road, water, rail and pipeline in the UK from 1974 to 2002.
Overall, both four different modes of transport experienced an upward trend, while road was highest mode and pipeline was lowest mode in four means of transport.
In 1974, road stood at approximately 70 million tonnes. In the meantime, pipeline was lowest mode in four modes of transport, at about 6 million tonnes. From 1978 to 1998, road and pipeline had a significant increase. Between 1998 and 2002, road went up sharply, while pipeline did not change. Road increased to approximately 95 million tonnes and pipeline stood at 20 million tonnes in 2002.
Water mode and rail mode stood at about 39 million tonnes and 40 million tonnes respectively in 1974. From 1974 to 1998, water and rail showed some fluctuations. Water mode had a subtantial rise, while rail had a small increase. In 2002, water mode increased to 62 million tonnes and rain mode rose slightly of 1 million tonnes.
Top answer
The line graph compares the amounts of goods delivered by four means of transport, namely road, water, rail and pipeline in the UK from 1974 to 2002. Overall, both all four different modes of transport experienced an upward tren ds , while road haulage was highest mode transported the most and pipeline transport carried the least throughout the given period. was lowest mode in four means of transport.
- The line graph compares the amounts of goods delivered by four means of transport, namely road, water, rail and pipeline in the UK from 1974 to 2002.
- Overall, both all four different modes of transport experienced an upward tren ds , while road haulage was highest mode transported the most and pipeline transport carried the least throughout the given period.
- was lowest mode in four means of transport.
- In 1974, goods transported by road stood at approximately 70 million tonnes.
- In the meantime, pipeline was lowest mode in four modes of transport, at only about 6 million tonnes were carried by pipeline .
Get the Weekly English Kit 📬
New words, one handy idiom, and a 2-minute quiz — delivered to your inbox to keep your streak alive.
The line graph compares the amounts of goods delivered by four means of transport, namely road, water, rail and pipeline in the UK from 1974 to 2002.
Overall, both all four different modes of transport experienced an upward trends, while road
 Related Questions