
PLS!!! Help me by checking my writing task 1 _ Cam 8
Topic: The graph below shows the quantities of goods transported in the UK between 1974 and 2002 by four different modes of transport.
Summarise the information by selecting and reporting the main features, and make comparisons where relevant.
My writing task 1:
The line graph compares the amounts of cargo delivered from 1974 to 2002 in the UK by four means of transport.
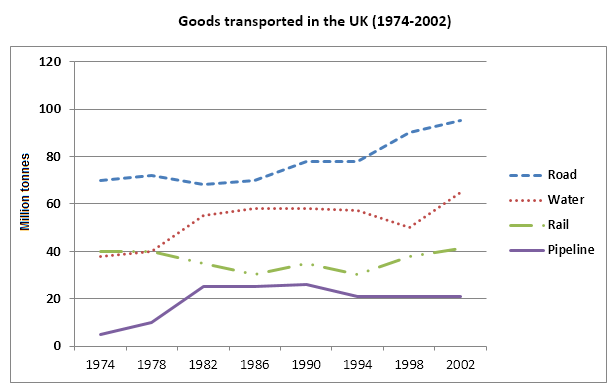
Overall, the quantities of good transported in the UK showed an upward trend. Road was responsible for the transportation of most goods over the period.
In 1974, approximately 70 million tonnes of cargo delivered by road. In the same time, the amounts of goods transported by water and rail experienced a similar amount, at approximately 40 millions tonnes. Goods transported by pipeline was the lowest amount, only about 5 million tonnes.
From 1974 to 2002, goods transported by road increased, with its figure standing at about 95 miilion tonnes. Despite a stability in the first 4 years, water and rail transports showed different trends. The amount of cargo delivered by rail had some fluctuations and in 2002, goods transported had an similar percentage as in 1974, at about 40 million tonnes. In contrast, the quantity of goods transported by water decreased slightly in 1998 and climbed to over 60 million tonnes in 2002. Pipeline became more popular and it increased at about 21 million tonnes at the end.
Get the Weekly English Kit 📬
New words, one handy idiom, and a 2-minute quiz — delivered to your inbox to keep your streak alive.
 Related Questions