
PLS!! Help me by checking my task 1_ Waste production
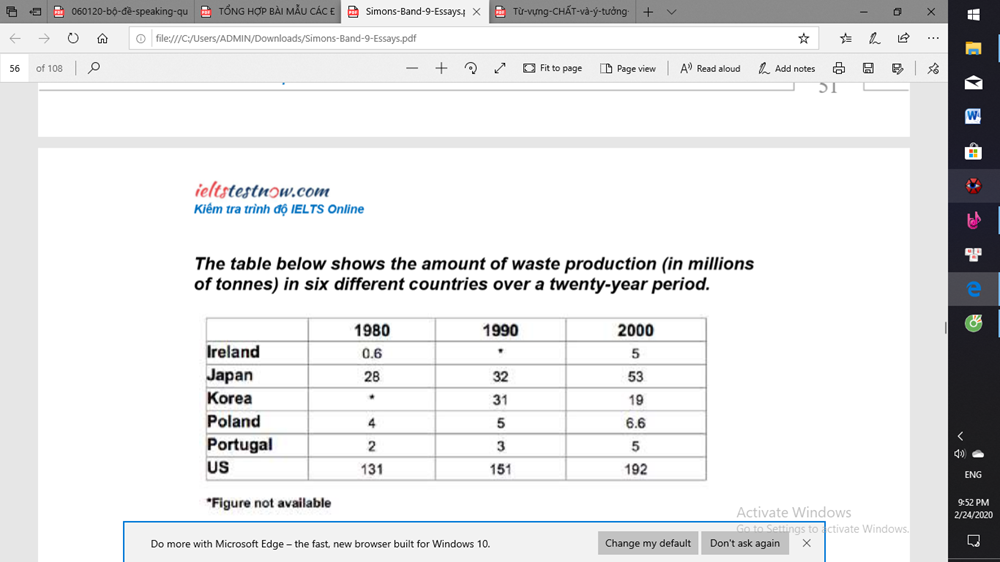
Topic: The table below shows the amount of waste production (in millions of tonnes) in six different countries over a twenty - year period.
My task 1:
The table gives information about the amount of waste that was produced in Ireland, Japan, Korea, Poland, Portugal and UK in 1980, 1990 and 2000.
Overall, the US produced the highest amount of waste over a twenty-year period and there were an increase in the number of Ireland, Japan, Poland and Portugal. In contrast, only Korea had a decrease in the amount of waste production.
In 1980, the US had 131 million tonnes, whereas only 0,6 million tonnes were produced in Ireland. From 1980 to 1990, the amount of waste production increased in Japan and the US, by 4 million tonnes and 20 million tonnes respectively. Meanwhile, Poland and Portugal had the equal increase between 1980 and 1990, by 1 million tonnes.
The amount of waste production in Ireland and Korea just had shown in two years. In 1980, Ireland produced 0,6 million tonnes. Over a twenty-year period, Ireland had a significant increase, at 5 million tonnes in 2000. In contrast, waste production in Korea decreased from 31 million tonnes in 1990 to 19 million tonnes in 2000.
Top answer
The table gives information about the amount of waste that was produced in Ireland, Japan, Korea, Poland, Portugal and UK in 1980, 1990 and 2000. Overall, the US produced the highest amount of waste over a twenty-year perio d a nd there were an increase in the number of Ireland, Japan, Poland and Portugal. In contrast, only Korea had a decrease in the amount of waste production.
- The table gives information about the amount of waste that was produced in Ireland, Japan, Korea, Poland, Portugal and UK in 1980, 1990 and 2000.
- Overall, the US produced the highest amount of waste over a twenty-year perio d a nd there were an increase in the number of Ireland, Japan, Poland and Portugal.
- In contrast, only Korea had a decrease in the amount of waste production.
- In 1980, the US had 131 million tonnes, whereas only 0 , 6 million tonnes were [ We are not talking about individual tonnes; we are talking about an amount] produced in Ireland.
- From 1980 to 1990, the amount of waste production increased in Japan and the US, by 4 million tonnes and 20 million tonnes respectively.
Get the Weekly English Kit 📬
New words, one handy idiom, and a 2-minute quiz — delivered to your inbox to keep your streak alive.
The table gives information about the amount of waste that was produced in Ireland, Japan, Korea, Poland, Portugal and UK in 1980, 1990 and 2000.
Overall, the US produced the highest amount of waste over a twenty-year period and there were an increa
 Related Questions