
PLS!! Help me by checking my task 1 _ Poverty
Topic: The table below shows the proportion of different categories of families living in poverty in Australia in 1999.
My task 1:
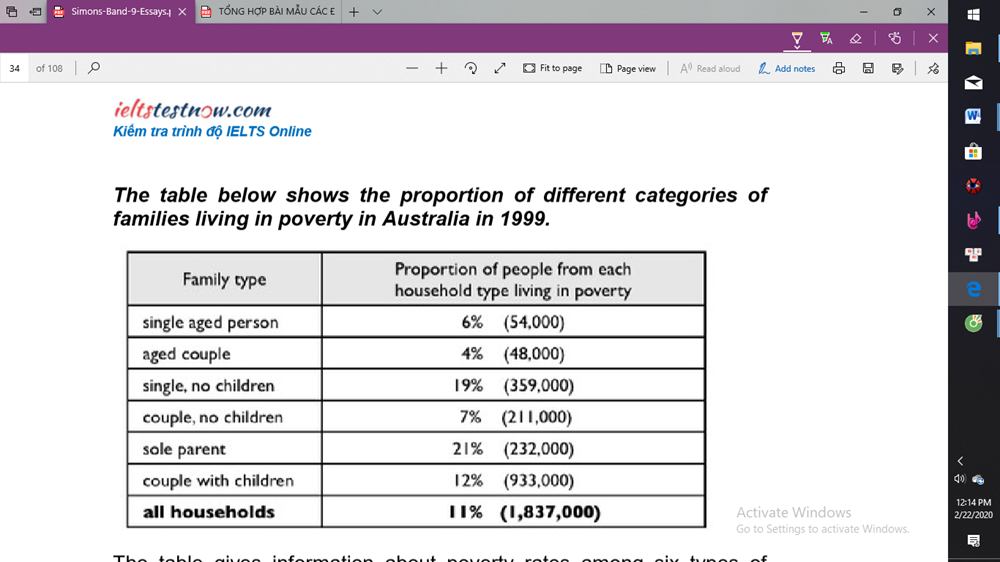
The table gives information about the poverty rates among six types of household in Australia in the year 1999.
Overall, the levels of poverty is the highest in sole parents, while the opposite is true for aged couple which has the lowest percentage of poverty rates. In general, 11% Australians or 1,837,000 people were living in poverty in 1999.
The proportions of aged couple, single and couple with no children in poverty were low. At 4% of aged couple or 48.000 people who were living in poverty. The poverty levels of single aged person and couple without children was high compared with aged couple’s poverty level, at 6% and 7% respectively.
In contrast, the number of people who are sole parents was the highest, with 232,000 people or accounted for 21% in families living in poverty. Moreover, 19% single people living in poverty, whereas only 12% of poor couple with children.
Top answer
The table gives information about the poverty ( rates and actual numbers) among six types of household in Australia in the year 1999. Overall, the lev els of poverty is the highest in sole parents, while the opposite is true for aged coup le which has the lowest percentage of poverty rates. In general, 11 % A ustralian s o r 1,837,000 peopl e w ere living in poverty in 1999.
- The table gives information about the poverty ( rates and actual numbers) among six types of household in Australia in the year 1999.
- Overall, the lev els of poverty is the highest in sole parents, while the opposite is true for aged coup le which has the lowest percentage of poverty rates.
- In general, 11 % A ustralian s o r 1,837,000 peopl e w ere living in poverty in 1999.
- The proportions of aged coupl e , singl e and coupl e with no children in poverty were low.
- 000 people who were living in poverty.
Get the Weekly English Kit 📬
New words, one handy idiom, and a 2-minute quiz — delivered to your inbox to keep your streak alive.
The table gives information about the poverty (rates and actual numbers) among six types of household in Australia in the year 1999.
Overall, the levels of poverty is the highest in sole parents, while the opposite is true for aged couple
 Related Questions