
Pls give feedback: task 1
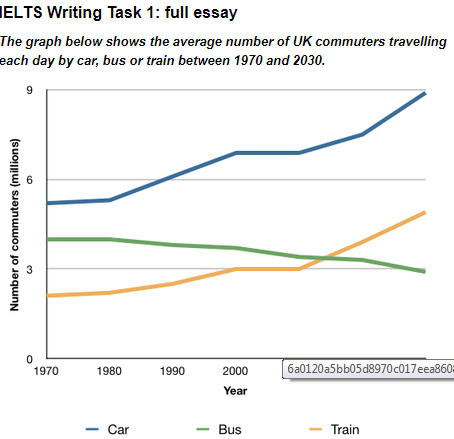
The line graph illustrates the alterations in the number of travelers in the UK using three modes of transportation (car, bus and train) over 40 years between 1970 to present and into the future up to 2030.
Overall, car users outnumbered those commuting either by bus or train and it will continue to be the most popular mode of transportation until the final year. Although both train and car commuters showed an increase and are predicted to further rise in the future, the opposite trend was and will be observed in those traveling by bus.
From 1970 to 1980, there were about 5 million car users in the UK. This figure then rose to about 7 million in 2000, then it remained steady at that level for the subsequent 10 years. From this point, it climbed up and is expected to peak in 2030 with almost 9 million. The same pattern was seen in those who commuted by train, which will also reach its highest level in the final year with around 5 million.
In terms of the number of bus commuters, it began at 4 million and it steadily dropped to around 3.5 million today and will further dive below 3 million in 2030.
Top answer
The line graph illustrates (wrong word choice) the alterations (wrong word) in the number of travelers (wrong word - all travellers are not commuters. ) in the UK using three modes of transportation (car, bus and train) over 40 (The time period of the graph is 60 years. ) years between 1970 to present and into the future up to 2030.
- The line graph illustrates (wrong word choice) the alterations (wrong word) in the number of travelers (wrong word - all travellers are not commuters.
- ) in the UK using three modes of transportation (car, bus and train) over 40 (The time period of the graph is 60 years.
- ) years between 1970 to present and into the future up to 2030.
- Overall, car users outnumbered those commuting either by bus or train and it will continue to be the most popular mode of transportation until 2030 the final year .
- Although both train and car commuters showed an increase and are predicted to further rise in the future, the opposite trend was and will be observed in those traveling by bus.
Get the Weekly English Kit 📬
New words, one handy idiom, and a 2-minute quiz — delivered to your inbox to keep your streak alive.
The line graph illustrates (wrong word choice) the alterations (wrong word) in the number of travelers (wrong word - all travellers are not commuters. Also, your description is incorrect.) in the UK using three modes of transportation
 Related Questions