
0
Thanhnam46 Posted 15 years ago
Essay & Composition Writing
Pls! check this report for me!!! Thanks
This is a IELTS writing task 1 from book: IELTS 8. I'm trying for my IELTS exam. Please! Check this for me. Thanks all!!!
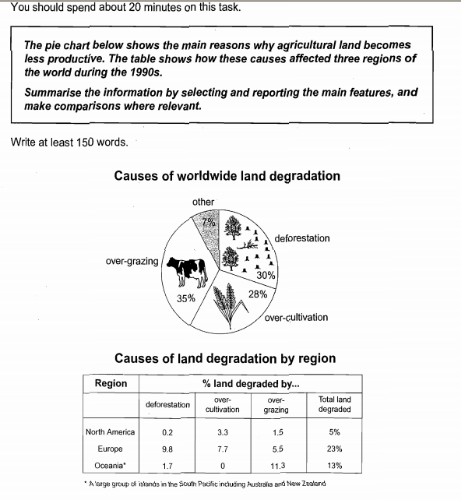
The pie chart, combined with the table provides an overview of the rates of causes which make the land decrease and the land reduction in specific areas during 1990s.
It can be seen in the pie chart that the over-grazing is the biggest cause which get 35 percent of total causes. Whereas, the deforestation take the second position with 30 percent and the third position with a little bit less is taken by the over-cultivation at 28 percent. The other causes occupy the smallest percentage by 7 percent. It is clearly seen in the table that the deforestation is the biggest reason which make the land reduction in Europe. In addition, the main causes of land decline in North America and Oceania are over-cultivation by 3.3 percent and over-grazing by 11.2 percent respectively. In total land degraded, the highest decrease is happened in Europe with 23% and the lowest rate is caught by North America with 5 percent.
(158 words)
Top answer
The pie chart, combined with the table , provides an overview of the [rates of - I don't think this is needed, I don't think the rates are shown, only the percentages] causes which make degrade the land and the land degradation in specific areas during the 1990s. It can be seen in the pie chart that over-grazing is the biggest cause at 35 percent of total causes. Deforestation takes the second position with 30 percent and the third position , with a little bit less , is taken by over-cultivation at 28 percent.
- The pie chart, combined with the table , provides an overview of the [rates of - I don't think this is needed, I don't think the rates are shown, only the percentages] causes which make degrade the land and the land degradation in specific areas during the 1990s.
- It can be seen in the pie chart that over-grazing is the biggest cause at 35 percent of total causes.
- Deforestation takes the second position with 30 percent and the third position , with a little bit less , is taken by over-cultivation at 28 percent.
- The other causes occupy the smallest percentage at 7 percent.
- It is clearly seen in the table that deforestation is the biggest reason for the land degradation in Europe.
Get the Weekly English Kit 📬
New words, one handy idiom, and a 2-minute quiz — delivered to your inbox to keep your streak alive.
2 Answers
0
The pie chart, combined with the table, provides an overview of the [rates of - I don't think this is needed, I don't think the rates are shown, only the percentages] causes which make degrade the land and the land degradation in specific areas during
0
thanks for your comment!!! I've read it. And it really helps me. I will practice more and more. Hope that you help me next times. Thanks again!!!
 Related Questions