
0
Thanhnam46 Posted 15 years ago
Essay & Composition Writing
Pls! check this report for me
Hi ! This is my report for IELTS Task 1. Pls check it for me! thank so much!
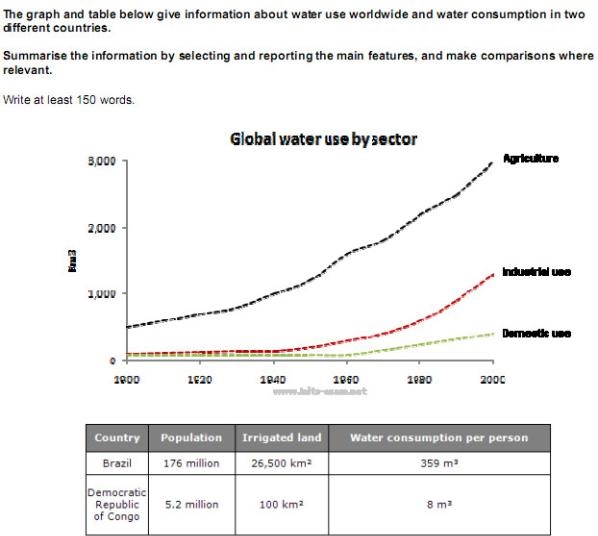
The line chart reveals the amount of water which is used for agriculture, industrial and domestic need all over the world in 20th century. It is clear that the agriculture use occupy the highest quality of water through 20th century. Whereas the second position is taken by industrial use and the lowest amount of water usage belong to domestic need. Particularly, the volume of water use for agriculture was 500Km3 in 1900. After that, it rose dramatically to 3000Km3 in 2000. Whilst, the amount of water use for industrial and domestic show the same trend from 1920 to 1940. Both of them remained stable at 110Km3 and 100Km3 respectively. Between 1940 and 1960, the water usage in industrial increased gradually to 300Km3 while amount of water use for domestic still level off. From 1960 to 2000, both of the numbers mentioned above demonstrate an upward trend with different degrees. The water usage for industrial had a significant increase and reach 1300Km3 in 2000 whereas the quantity of water use for domestic grown gradually to 500Km3.
The table illustrates the amount of water use by each citizen in two different countries Brazil and Congo. It is clear that the water usage of a Brazilian was 359m3, about 45 times than the water amount use by a citizen of Congo. ((217words))
Top answer
Be very careful of word tense and number. For instance, in the first sentence, you have three categories of need, so the collection is a plural... agricultural, industrial, and domestic needs -- plural NEEDS rather than the singular NEED.
- Be very careful of word tense and number.
- For instance, in the first sentence, you have three categories of need, so the collection is a plural...
- agricultural, industrial, and domestic needs -- plural NEEDS rather than the singular NEED.
- Also notice that each of these need categories is used in a descriptive sense, so AGRICULTURE in that phrase should be AGRICULTURAL, the same way that you correctly used INDUSTRIAL rather than INDUSTRY.
- " There are other similar issues in your report, so see if you can find them.
Get the Weekly English Kit 📬
New words, one handy idiom, and a 2-minute quiz — delivered to your inbox to keep your streak alive.
2 Answers
0
Be very careful of word tense and number. For instance, in the first sentence, you have three categories of need, so the collection is a plural... agricultural, industrial, and domestic needs -- plural NEEDS rather than the singular NEED. Also notice that each of these need categories is used in a descriptive sense, so AGRICULTURE in that phrase should be AGRICULTURAL, the same way that you corr
0
 Related Questions