
PLS!! Check my IELTS Task 1 _ THANKS
Topic: The graph below shows the consumption of fish and different kinds of meat in a European country between 1979 and 2004.
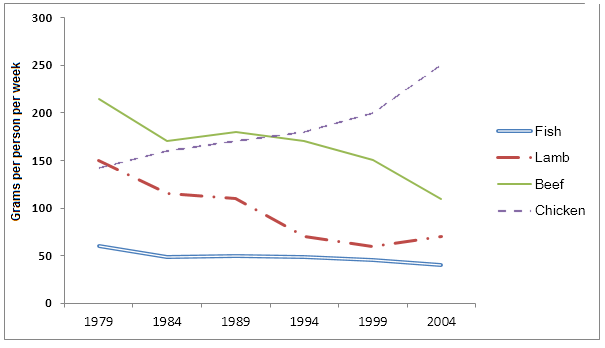
The line graph illustrates the expenditure of fish and some different kinds of meat in a European country from 1979 to 2004, a period of 25 years. Units are measured in grams per person per week.
Overall, chicken experienced an upward trend, while beef, lamb and fish showed downward trends.
In 1979, beef had a highest consumption and stood at 230 grams per person per week, followed by lamb, beef and fish. Between 1979 and 2004, beef expenditure had a huge decline. In 2004, beef fell to 120 grams. In 1979, lamb hit a peak at 150 grams weekly spending figures. Lamb had a dramatic decrease of approximately 80 grams. Fish dropped gradually and stood at 50 grams in 2004.
The chicken became the most widely used meat in the final years. The comsumption of chicken only started in 1979 about 140 grams on average. It hit a high at about 240 grams at the end of the graph.
NOTE: Can you give me IELTS score in my task 1?
Top answer
The line graph illustrates the expenditure (wrong word. ) of fish and three some different kinds of meat in a European country from 1979 to 2004, a period of 25 years. ) Units are measured in grams per person per week.
- The line graph illustrates the expenditure (wrong word.
- ) of fish and three some different kinds of meat in a European country from 1979 to 2004, a period of 25 years.
- ) Units are measured in grams per person per week.
- Overall, chicken experienced an upward trend, while beef, lamb and fish showed downward trends.
- In 1979, beef had a highest consumption and stood at 230 grams per person per week, followed by lamb, beef and fish.
Get the Weekly English Kit 📬
New words, one handy idiom, and a 2-minute quiz — delivered to your inbox to keep your streak alive.
The line graph illustrates the expenditure (wrong word. Expenditure relates to money, not food.) of fish and three some different kinds of meat in a European country from 1979 to 2004, a period of 25 years. (What are the varieties of meat?) Units are measured in grams per person p
 Related Questions