
Pleaseh help with IELTS Task 1!
Can somebody help me with this type of chart? What should I report in the overview and the bodies?
Thank you!
Top answer
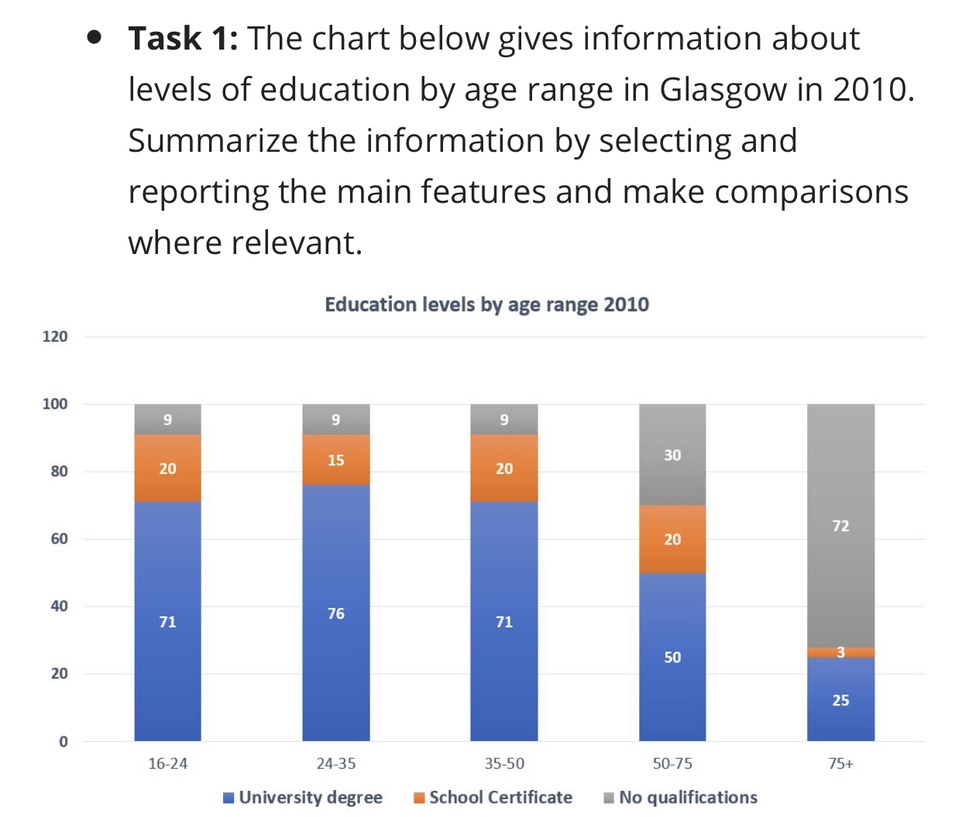
The stacked bar chart compares the education attainment of Glasgow residents in five age groups in the year 2016. Overall, the majority of people who were 75 years or younger had a university degree, whereas most of those who were older had no educational qualification whatsoever. Hint: For the main part of your text, write three brief paragraphs: one for for those aged 16-50, one for those 51-75, and one for the oldest group.
- The stacked bar chart compares the education attainment of Glasgow residents in five age groups in the year 2016.
- Overall, the majority of people who were 75 years or younger had a university degree, whereas most of those who were older had no educational qualification whatsoever.
- Hint: For the main part of your text, write three brief paragraphs: one for for those aged 16-50, one for those 51-75, and one for the oldest group.
- Be mindful not to write more than 180 words.
- Also, note that the chart is a little flawed (overlap in age groups, but you can get over that easily).
Get the Weekly English Kit 📬
New words, one handy idiom, and a 2-minute quiz — delivered to your inbox to keep your streak alive.
The stacked bar chart compares the education attainment of Glasgow residents in five age groups in the year 2016.
Overall, the majority of people who were 75 years or younger had a university degree, whereas most of those who were older had no educational qualification whatsoever.
Hint: For the main part of your text, write three brief paragraphs: one
 Related Questions