
Please teacher
The stacked bar chart plots the proportion of car supplier’s total sales in four areas, which are Asia, Europe, South America, and North America at a one-year interval from 2006 to 2010. At every measurement point, North America accounted for the smallest percentage of total sales, whereas Asia dominated the market share, followed by Europe and South America.
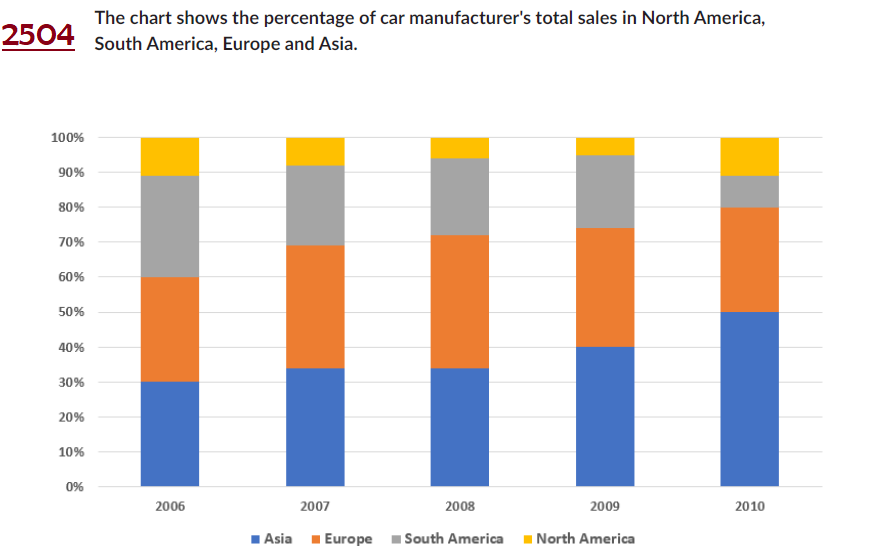
Starting out at 30% in 2006, the total sales of Asia increased and plateaued at around 32% in 2007 and 2008. The same pattern can be seen in European total sales. From 2009 onwards, the total sales of Europe were outnumbered by their Asian counterfeits, by a margin of 5%, 40% versus 35%. By 2010, the total sales of Asian car manufacturers had occupied half of the market share, nearly doubling that in Europe and quintupling the others.
The total sales in South America initially stood at 30%, before dipping a little and staying constant for three years starting from 2007. Subsequently, the percentage ended at 10% in 2010, about one-third of its initial value. The percentage in North America did not show any improvement over the period, varying in a narrow gap between 0% to 10%.
Top answer
The stacked bar chart plots the proportion of a car maker's supplier’s total sales in four areas , continents, which are Asia, Europe, South America, and North America, at a five one-year intervals from 2006 to 2010. ) At every measurement point, North America accounted for the smallest percentage of total sales, less than 12%, whereas Asia dominated the market share, followed by Europe and South America. Starting out at 30% in 2006, the total sales of Asia increased and plateaued at around 32% in 2007 and 2008.
- The stacked bar chart plots the proportion of a car maker's supplier’s total sales in four areas , continents, which are Asia, Europe, South America, and North America, at a five one-year intervals from 2006 to 2010.
- ) At every measurement point, North America accounted for the smallest percentage of total sales, less than 12%, whereas Asia dominated the market share, followed by Europe and South America.
- Starting out at 30% in 2006, the total sales of Asia increased and plateaued at around 32% in 2007 and 2008.
- The same pattern can be seen in European total sales.
- From 2009 onwards, the total sales to of Europe were outnumbered (The numbers of sales are not shown, only the amount.
Get the Weekly English Kit 📬
New words, one handy idiom, and a 2-minute quiz — delivered to your inbox to keep your streak alive.
The stacked bar chart plots the proportion of a car maker's supplier’s total sales in four areas, continents, which are Asia, Europe, South America, and North America, at a five one-year intervals from 2006 to 2010. (Ma
 Related Questions