
Please take a look at my Ielts Writing Task 1 ^^ Thanks
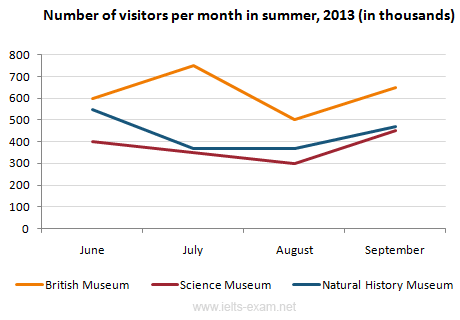
The line graph below gives information about the number of visitors to three London museums between June and September 2013.
The given line graph illustrates the quantity of visitors to three distinct museums in the capital of England over a course of three months in 2013.
Overall, the number of guests to British, Science and Natural History Museum witnessed an upward trend from June to September, with the British Museum being the most favored destination.
In June, the figure of British Museum visitors registered the highest among the three, standing at 600 thousand people. The number fluctuated between 500 and 750, then managed to increase to 650 at the end of the time frame. The Science Museum attracted the least visitors, about 400 thousand in June, then dropped marginally to 300 thousand then rose to roughly 450 thousand people in September. A similar trend could be seen in the number of people visiting the Natural History Museum. There was a sharp drop in visitors from June to July, the number remained stable in August and then observed an upturn to approximately 450 in September.
Top answer
The given (Do not use "given", "provided" or similar adjectives. Usually these are postposition. ) line graph illustrates (Not a good word choice.
- The given (Do not use "given", "provided" or similar adjectives.
- Usually these are postposition.
- ) line graph illustrates (Not a good word choice.
- Illustrate is for diagrams and drawings, not for plotted data.
- ) the quantity (wrong word.
Get the Weekly English Kit 📬
New words, one handy idiom, and a 2-minute quiz — delivered to your inbox to keep your streak alive.
The given (Do not use "given", "provided" or similar adjectives. Usually these are postposition. ) line graph illustrates (Not a good word choice. Illustrate is for diagrams and drawings, not for plotted data. ) the quantity (wrong word. Quantity is not used for people. It
teedeepto British, Science and Natural History Museum
to the British, Science and Natural History Museums. You need the because each one is a particular museum and museums plural because you are mentioning more t
 Related Questions