
Please review my writting task 1
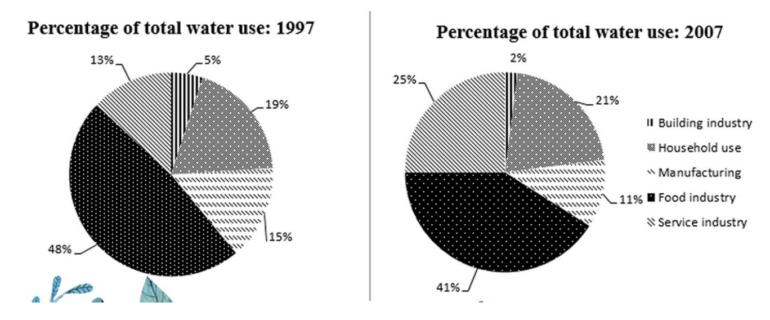
The charts below show the percentage of water used by different sectors in Sydney, Australia, in 1997 and 2007.
Summarize the information by selecting and reporting the main features, and make comparisons where relevant.
The pie charts give information on the proportion of water consumed by different purposes in Sydney, Australia in a 38-year period.
Overall, the food industry accounted for the highest proportion of water over the period, while that of the building industry is the least.
The food industry contributed the most to the total water use, 48% in 1997 and 41% in 2007. By contrast, the building industry used the lowest amount of water in total, its percentage in 1997 is 5% and decreased by 3% in 2007.
The second highest water's rate in 1997 is a fifth for household purposes, followed by manufacturing with 15%. Water used by the service industry took up a tenth of the total water use in 2997. However, in 2007, the second largest percentage of water, namely 17%, is used for the service industry, compared to 21% for household use and 11% for the manufacturing.
Get the Weekly English Kit 📬
New words, one handy idiom, and a 2-minute quiz — delivered to your inbox to keep your streak alive.
 Related Questions