
Please review my writting task 1
Essay topics: The charts below show the results of a survey conducted by a university library to find out the opinions of full-time and part-time students about its services.
The pie charts give information about full-time and part-time students' attitudes toward IT support and the opening hours.
Overall. most full-time and part-time students are satisfied with their opening hour, however, their feelings about IT support vary.
More than half of full-time students are very happy with IT support. By contrast, only a fifth of the part-time students is extremely pleased with it. The proportion of students who are dissatisfied with the help tripled that of full-time students. Meanwhile, part-time students and full-time students that feel account for 32% for the former and 35% for the latter.
It is clear that a massive percentage of full-time and part-time students are happy with their opening hours, 67% and 72 % respectively. On the other hand, the rate of students work full time that is unhappy is almost none, compared to 5% from part-time students. Finally, there is only a small percentage of students feel quite happy, 32% for the full time and 23 % for part-time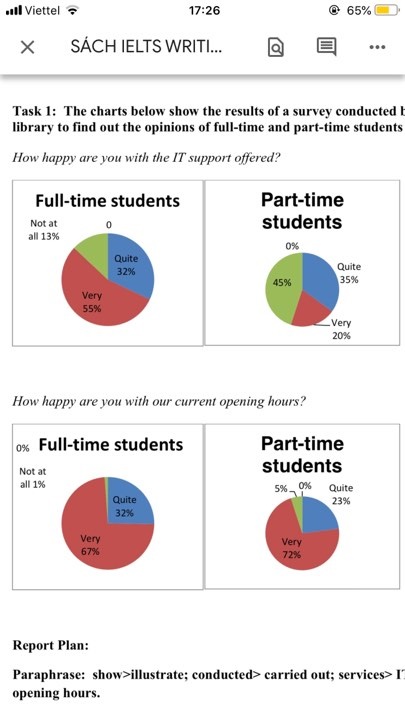
Top answer
The pie charts give information about how satisfied full-time and part-time students ' attitudes toward are regarding IT support and the opening hours in a library. The data came from a survey in which the student had to choose from three levels: not at all, quite, or very happy. Notice how incomplete your first paragraph is.
- The pie charts give information about how satisfied full-time and part-time students ' attitudes toward are regarding IT support and the opening hours in a library.
- The data came from a survey in which the student had to choose from three levels: not at all, quite, or very happy.
- Notice how incomplete your first paragraph is.
- You missed "library", "survey" and the three categories of satisfaction levels.
- These are critically important aspects of the figure.
Get the Weekly English Kit 📬
New words, one handy idiom, and a 2-minute quiz — delivered to your inbox to keep your streak alive.
The pie charts give information about how satisfied full-time and part-time students' attitudes toward are regarding IT support and the opening hours in a library. The data came from a survey in which the student had to choose from three levels: n
 Related Questions