
Please review my writing task 1. Thank you so much.
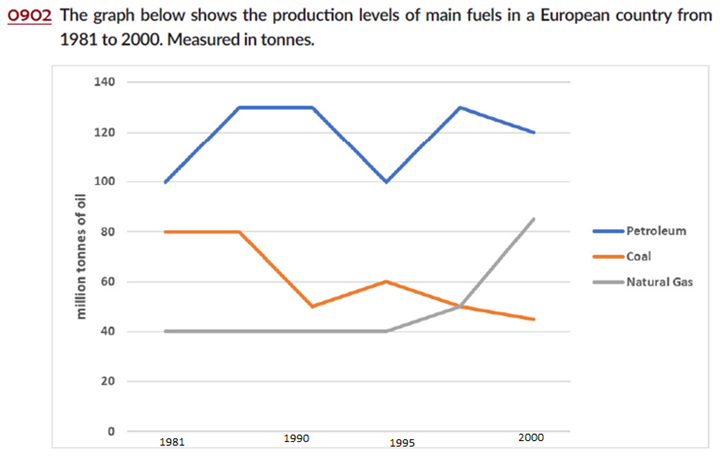
The line graph compares the amount of fuel produced in a European country over a period of 29 years. It is clear that petroleum was by far the most important power source over the period shown. Natural gas provided the lowest amount of fuel from 1981 to 1997, but it overcame coal to take second place. In 1981, petroleum was the main source of fuel in Europe, generating around 100 million tonnes of oil. Coal produced approximately 80 million tonnes of oil, and natural gas provided minimum fuel this year. For the whole 14-year period, fuel produced by natural gas remained relatively stable. Between 1995 and 2000, fuel production from coal fell to only 45 million tonnes. By contrast, the figure for natural gas had doubled since 1995, to around 85 million tonnes. During the same period, petroleum fuel generation rose dramatically to a peak of 130 million tonnes by 1997, but it plummeted to around 120 million tonnes since 2000.
Top answer
Please read my advice for Task 1 essays: IELTS TASK 1: Hints, Tips And Advice Vocabulary Words For Task 1: Reference Post
- Please read my advice for Task 1 essays: IELTS TASK 1: Hints, Tips And Advice Vocabulary Words For Task 1: Reference Post
Get the Weekly English Kit 📬
New words, one handy idiom, and a 2-minute quiz — delivered to your inbox to keep your streak alive.
The first problem of your essay is that it consists of one paragraph. That will result in a very low score for "coherence and cohesion" which is based on effective paragraphing as well as good transitions.
Also, you did not study this graph very carefully. Most of your report was incorrect.
Read my advice for the paragraph structure of Task 1 essays.
1. In the first
 Related Questions