
Please review my writing task 1. Thank you so much.
Answer
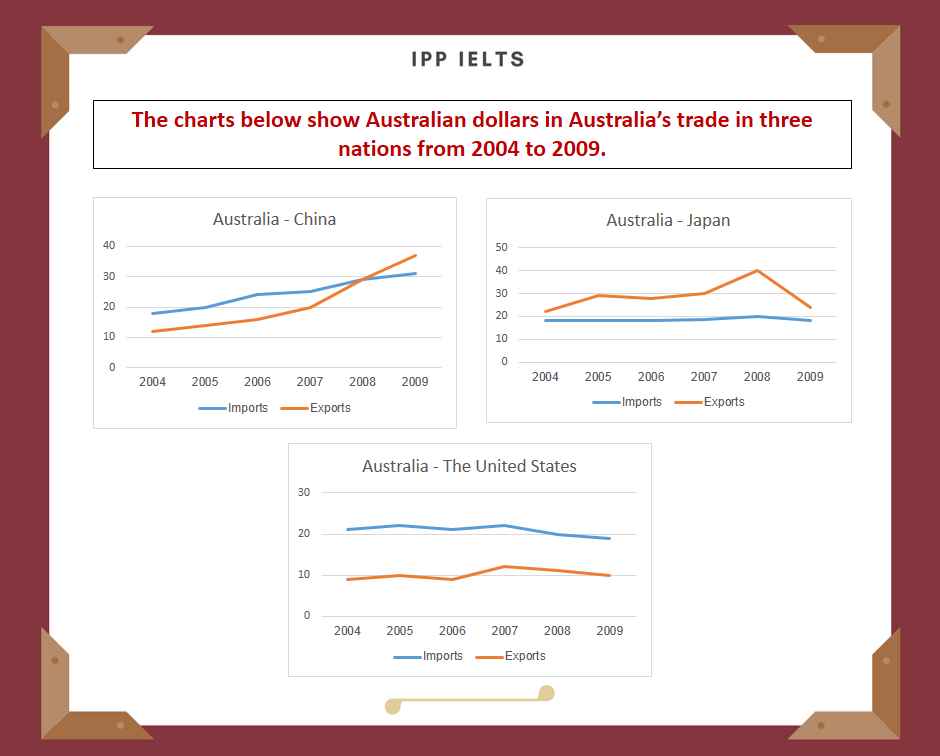
The line graphs compare the Australian trade with three other countries (the USA, Japan and China) from 2004 to 2009.
Overall, the value of trade with the USA remained stable throughout the period, while the value of exports and imports with Japan and China oscillate dramatically.
In 2004, imports from the USA were at 10 billion Australian dollars, this numbers of imports rose to 11 billion dollars by the end of the period. The value of exports experienced a similar trend, but considerably higher at about 30 billion throughout the year.
On the other hand, form 19 billion dollars in 2004, the value of imports in Japan reached its peak of 40 billion dollars in 2008 before dropping to 31 billion dollars in 2009. Exports to Japan fluctuated between 10 billion dollars to 14 billion dollars over a 6-year period. The value of imports from China increased from 11 billion to 40 billion dollars throughout the period, while the export trade also rose to 31 billion dollars in 2009.
Top answer
This is not a good source for IELTS practice essays. The heading of the infographic is not good English, and it is not an example of what is on the real Task 1 exams. I would that you use an official source with actual IELTS exam questions.
- This is not a good source for IELTS practice essays.
- The heading of the infographic is not good English, and it is not an example of what is on the real Task 1 exams.
- I would that you use an official source with actual IELTS exam questions.
- The line graphs compare the Australian imports and exports trade with three other countries (the USA, Japan and China) from 2004 to 2009.
- ) dramatically .
Get the Weekly English Kit 📬
New words, one handy idiom, and a 2-minute quiz — delivered to your inbox to keep your streak alive.
This is not a good source for IELTS practice essays. The heading of the infographic is not good English, and it is not an example of what is on the real Task 1 exams. I would that you use an official source with actual IELTS exam questions.
The line graphs compare the Australian imports and exports trade with thr
 Related Questions