
Please review my writing task 1. Thank you.
Task 1: The table below shows the prices of a cup of coffee in 6 cities in Australia in 2010 and 2014.
My essay:
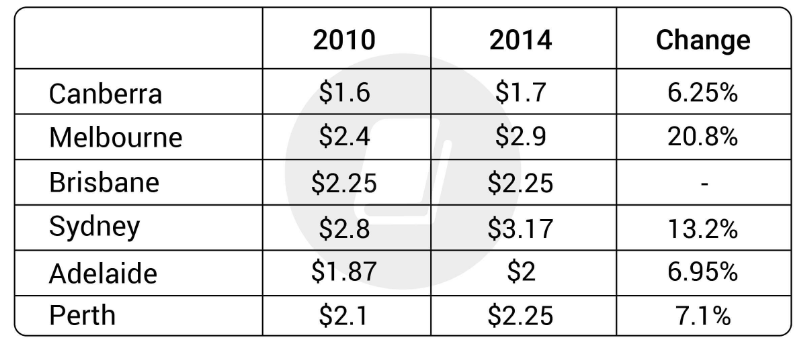
The table presents the cost of coffee per a cup and their change rate in six different cities in Australia over a four-year period from 2010.
It is obvious that there was an increase in the price of a cup of coffee over the period shown. While the cost per cup of coffee in Melbourne witnessed the biggest change, that in Brisbane did not change within 4 years.
In 2010, the people had to spend $2.8 on drinking a cup of coffee in Sydney, whereas the expense for that in Melbourne and Perth was $2.4 and $2.1 respectively. In the following four years, Sydney was still the most expensive city for buying a cup of coffee, was $3.17. However, the percentage of price change in Melbourne was biggest, by 7.6% and 13.7% compared to Sydney and Perth.
In 2010, the price of a cup of coffee was $1.87 in Adelaide and $1.6 in Canberra. In four years later, the percentage change in Adelaide was higher than in Canberra by 0.65%. While five cities in Australia witnessed a rise in the cost per a cup of coffee, Brisbane remained unchanged at $2.25 from 2010 to 2014.
Top answer
[ 1] The table presents compares the cost of a cup of coffee per a cup and their change rate in six different cities in Australia [ 2 ] over a four-year period from in 2010 and 2014 . It is obvious that Overall, t here was an increase in the price of a cup of coffee over the period shown in five of those cities, and w hile the cost per cup of coffee in Melbourne witnessed the biggest change, that prices in Brisbane did not chang e. within 4 years.
- [ 1] The table presents compares the cost of a cup of coffee per a cup and their change rate in six different cities in Australia [ 2 ] over a four-year period from in 2010 and 2014 .
- It is obvious that Overall, t here was an increase in the price of a cup of coffee over the period shown in five of those cities, and w hile the cost per cup of coffee in Melbourne witnessed the biggest change, that prices in Brisbane did not chang e.
- within 4 years.
- 1 , respectively.
- 17.
Get the Weekly English Kit 📬
New words, one handy idiom, and a 2-minute quiz — delivered to your inbox to keep your streak alive.
[ 1] The table presents compares the cost of a cup of coffee per a cup and their change rate in six different cities in Australia [ 2] over a four-year period from in 2010 and 2014
 Related Questions