
Please review my writing task 1 thank you
The first chart below shows how energy is used in an average Australian household. The second chart shows the greenhouse gas emissions which result from this energy use.
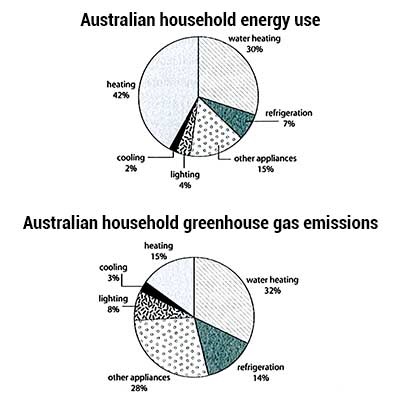
The first part chart illustrates the way in which energy is consumed in a typical Australian home.
Whereas the second chart provides information about the Australian household's greenhouse gas emissions( in percentage) using this energy.
Overall, a significant portion of energy usage is made up of heating and water heating. By comparison, cooling contributed the latest. According to the second chart, cooling emitted the lowest amount of greenhouse gases as well.
Heating came first by comprising 40% of the energy usage. While water heating came second with 30% and other appliances took 15% of the chart. Cooling made up the lowest portion( only 2% of the total consumed energy ) and lighting came second from the end using 4% of the households' energy.
Regarding the second chart, the water hitting segment emitted 32% of the whole produced greenhouse gases, followed by other appliances segment with 28%. Refrigeration and heating had a slight difference by emitting 14% and 15% of the total emission respectively. Cooling contributed the least and stood for only 4 percent of the greenhouse gas emissions.
Get the Weekly English Kit 📬
New words, one handy idiom, and a 2-minute quiz — delivered to your inbox to keep your streak alive.
 Related Questions