
Please review my writing task 1 thank you
The charts below show the average percentages in typical meals of three types of nutrients, all of which may be unhealthy if eaten too much.
Summarise the information by selecting and reporting the main features, and make comparisons where relevant.
The bar charts illustrate the average percentages in regular males containing three types of different nutrients (sodium, saturated fat and added sugar). which are unhealthy if there are over-consumed, in the USA.
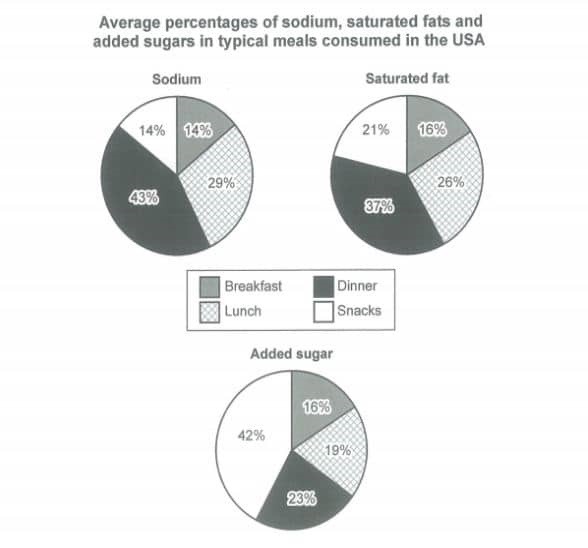
Overall, sodium and saturated fat are mostly consumed at dinner meals whereas snacks have the largest portion on sugar added meals chart.
Breakfast and snacks each make up 14% of the sodium chart. The highest level of sodium (43%) is consumed during dinner while lunch stands for (29%) of the sodium pie chart. The majority of 37% of saturated fat( ST) is received at dinner. The lowest segment of  belongs to breakfast by 10%. Launch with 26% as well as snacks with 21% came second and third respectively.
As for the sugar added meals, a significant portion of 42% is consumed during snack times. Launch comprises 19% of sugar-added meals. In the meantime, dinner accounts for 23% of the chart and Breakfast comes last with only 16%.
Could i have used typycal instead of average or regular?Thank you
Get the Weekly English Kit 📬
New words, one handy idiom, and a 2-minute quiz — delivered to your inbox to keep your streak alive.
 Related Questions