
Please review my writing task 1 thank you
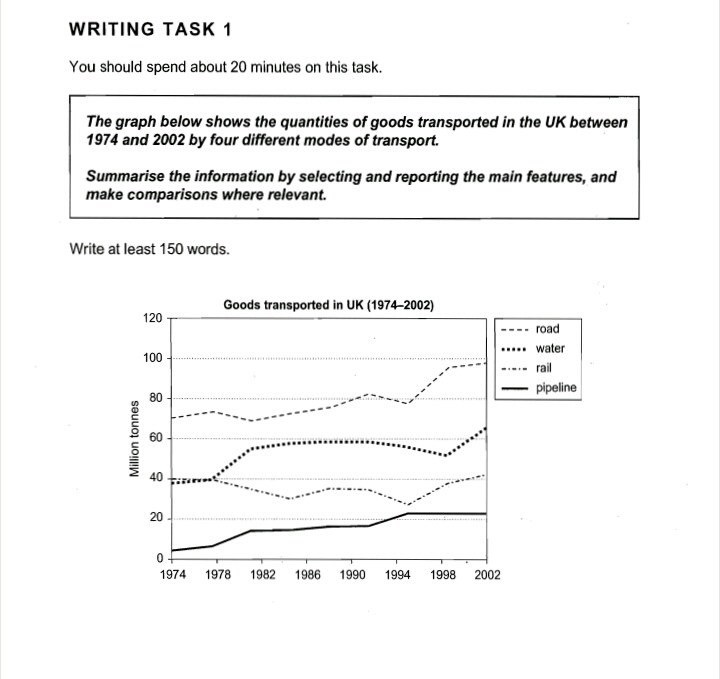
The given line graph illustrates the amount of traded commodities in the UK, in million tonnes, by various transport approaches from 1974 to 2002.
According to the graph, pipeline, water transportation, along with ground roads, which were the most selected option among them all, have had increased in their figures. As for the railway, despite rapid changes, only a fractional rise can be seen over the 28 years.
With regards to the goods transported by roads, it began at approximately 70 million tonnes and fluctuated till 1982 and had a gradual surge from 1982to about 1990. Afterward, a slight decrease and thenceforth the trend is on the rise reaching roughly 100million tonnes. The number of commodities moved through water is around 40 million tones in 1974 after gradual, steady climb figures dropped from the early 90s to 1998. It rose again and had a peak of over 60 million tonnes by 2002.
The pipeline category had an upward trend from the beginning of the duration untill1994. It rose to over 20 million tonnes later leveled off and remained stable. The railway group oscillated noticeably between 1978 to 2002. However, numbers were bearly over 40 million tones which were more or less the same as 1974.
Top answer
Please read my advice for Task 1 essays. I posted it on your last Task 1 essay, but you did not read it! IELTS TASK 1: Hints, Tips And Advice Vocabulary Words For Task 1: Reference Post
- Please read my advice for Task 1 essays.
- I posted it on your last Task 1 essay, but you did not read it!
- IELTS TASK 1: Hints, Tips And Advice Vocabulary Words For Task 1: Reference Post
Get the Weekly English Kit 📬
New words, one handy idiom, and a 2-minute quiz — delivered to your inbox to keep your streak alive.
Please read my advice for Task 1 essays. I posted it on your last Task 1 essay, but you did not read it!
The given (Unnatural. Do not use "provided" or "given" ) line graph illustrates (wrong word. Read my advice.) the amount of traded commodities (wrong word. Commodities are only a certain kind of goods. ) in the UK, in million tonnes, by
Sample essay (~190 words)

Notes:

1. I define and use the abbreviation for millions of tonnes (megatonnes): MT. Using abbreviations for the units of measure avoids a lot of repetition; it is a good way to get more points.

2. To achieve the best cohesion and coherence, all the elements of the figure that you write about in the body paragraphs should be introduced in
 Related Questions