
Please review my Writing Task 1 essay.
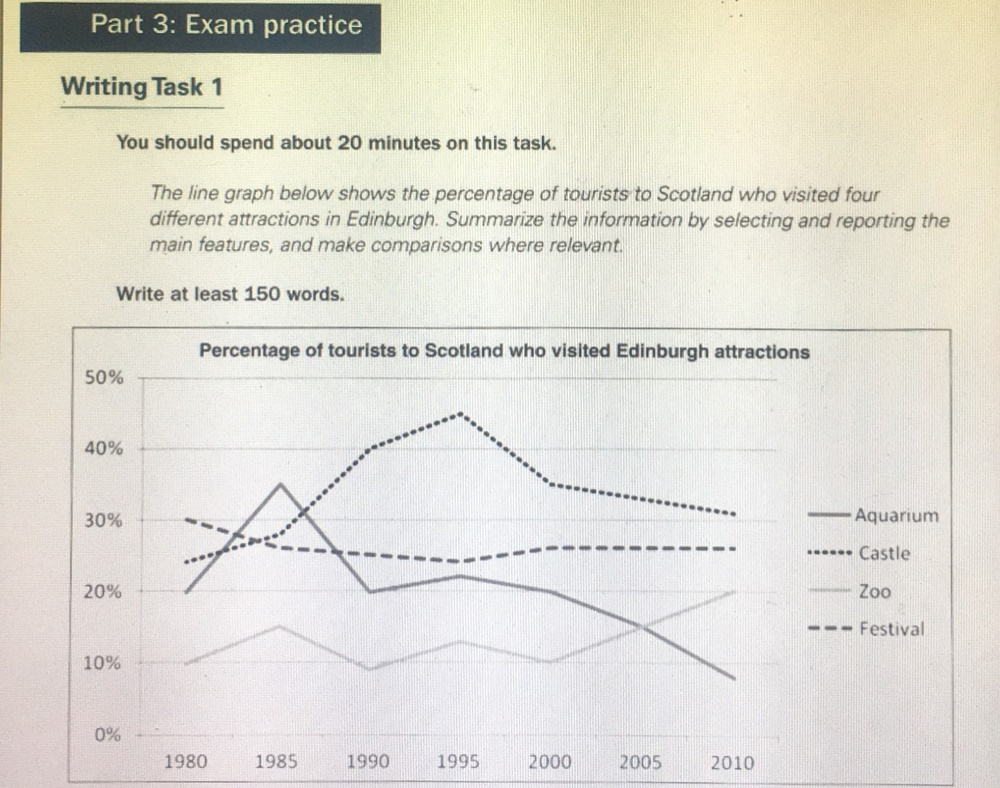
The graph shows the percentage of tourist to Scotland who visited Edinburgh attractions.
We can see the fluctuated changes in all the lines in the graph. There was a sharp fluctuation in the tourists visited aquarium percentage from 1980 to 2010.
The highest point that the line depicting tourists visted aquarium percentage touches is about 35%. On the other hand, the percentage of castle made most specifically changes with the highest rate it reached in about 45% and the lowest rate was nearly 25%. The rate increased strongly from 1980 to 1995 and went up astonishingly from then to 2010 afterwards. Next, the zoo’s percentage changed unstably and evidently. Eventually, the rate of festival visitors of tourists varied fluctuated but more stably , lastly reached about 26%, which is smaller than the first rate . It diminished gradually from 30% to 25% between 1980 and 1995, then went up a little bit and maintained at the same level in the graph finally.
We can see that in 1980 and in 2010 the favourite attractions were the castle and the festival. In 1980 the least popular attraction was the zoo but in 2010 this changed and the aquarium was the least popular.
Get the Weekly English Kit 📬
New words, one handy idiom, and a 2-minute quiz — delivered to your inbox to keep your streak alive.
 Related Questions