
Please review my Writing Task 1 essay
Topic:
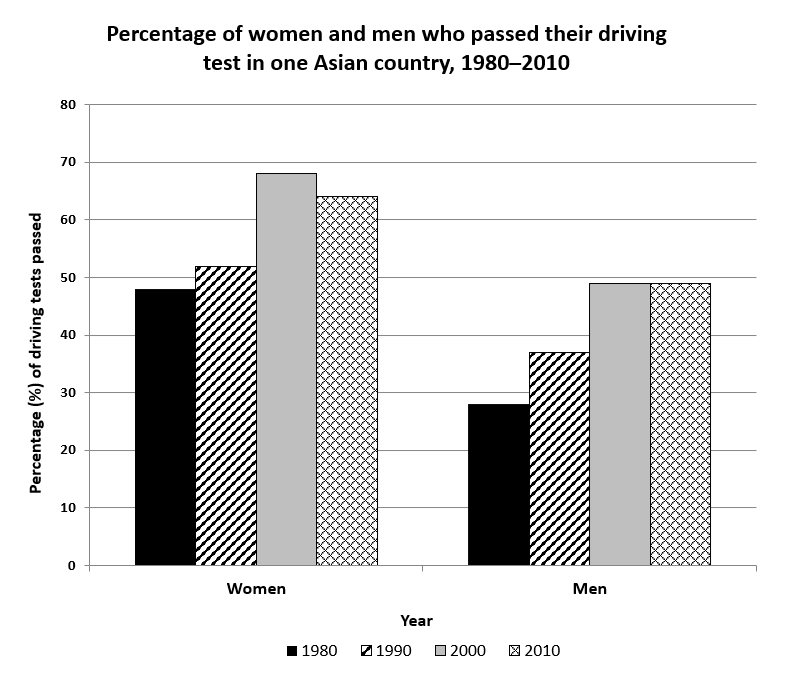
The chart shows the percentage of women and men in one Asian country who passed when they took their driving test between 1980 and 2010.
Summarise the information by selecting and reporting the main features, and make comparisons where relevant.
You should spend about 20 minutes on this task.
My essay:
The bar chart illustrates the proportion of females and males passing the driving test in 1980, 1990, 2000, and 2010.
Overall, there was an increase in the percentage of people succeeding in the driving test in both sexes. Women generally have a higher proportion of success in the test than that of men.
In 1980, nearly half of female drivers taking the test passed, while the figure for male stood at around 30%. In the following 10 years, both men and women experienced a growth in the percentage of passing, to 51% and 38% respectively.
By the next decade, the rate of women succeeded in the driving test climbed significantly to reach its highest, at about 70%. Subsequently, this figure fell to 55% at the end of the period. On the other hand, between 2000 and 2010, there was no change in the percentage of men who passed the test, with the figure stood at approximately 49%.
Top answer
Please read my advice for Task 1 essays. They describe your incorrect vocabulary usage: figure, experience and rate IELTS TASK 1: Hints, Tips And Advice Vocabulary Words For Task 1: Reference Post
- Please read my advice for Task 1 essays.
- They describe your incorrect vocabulary usage: figure, experience and rate IELTS TASK 1: Hints, Tips And Advice Vocabulary Words For Task 1: Reference Post
Get the Weekly English Kit 📬
New words, one handy idiom, and a 2-minute quiz — delivered to your inbox to keep your streak alive.
Please read my advice for Task 1 essays. They describe your incorrect vocabulary usage: figure, experience and rate
IELTS TASK 1: Hints, Tips And Advice
The bar chart illustrates (read my advice - wrong word) the proportion percentage of females and males passing the driving test in 1980, 1990, 2000, and 2010.
Overall, there was an increase in the percentage of people succeeding in passing
Sample essay:
Outline:
Paragraph 1: describe all aspects of the figure. Do not mention any data values.
Paragraph 2: select and report two or three main features. This is in all task 1 instructions. You must clearly indicate you most important observations.
Paragraph 3: Continue to report some details, but focus especially on comparing values. Combine categories where poss
 Related Questions