
Please review my writing task 1 essay.
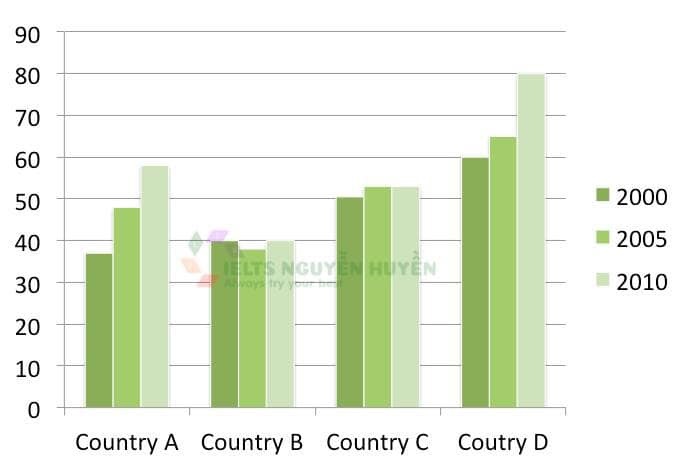
The clustered bar chart compares the percentage of youngster who got into higher education in four different countries in 2000, 2005 and 2010. These were country A, country B, country C and country D.
Overall, there was more than a half of young person in higher education in country C and country D each year. The proportion of country A rose steadily during the period shown. The value for country B did not go outside the range of 35%-40% from 2000 to 2010.
In detail, country D had more people who chose higher education than other countries in 2000, 2005 and 2010. In 2000, country D reached its highest level of precisely 80%, more than two times than country B, at about 40%. Country C had no change over the last five years, with around 53% each year. The pattern was similar in country B, which had no difference between 2000 and 2010. Country A started out with only 38%, but it ended up with an increase of 20% in 2010.
p/s: I feel that my essay was not really good enough, so I would appreciate if you give me an example one. It is really helpful for me. Thank you for your kind <3
Top answer
You forgot to include the essay instructions. toof12 youngster A youngster is a child aged 7-12. A percent of youngster means a portion of the child's body.
- You forgot to include the essay instructions.
- toof12 youngster A youngster is a child aged 7-12.
- A percent of youngster means a portion of the child's body.
- toof12 a half of young person They top half (from the waist up), or the bottom half (legs and feet)?
Get the Weekly English Kit 📬
New words, one handy idiom, and a 2-minute quiz — delivered to your inbox to keep your streak alive.
You forgot to include the essay instructions.
toof12youngster
A youngster is a child aged 7-12. A percent of youngster means a portion of the child's body.
toof12a half of young person
They top half (from the waist up), or the bottom half (legs and feet)?
The clustered bar chart compares the percentage of youngster (wrong word) who got into are enrolled in higher education in four different countries in 2000, 2005 and 2010. These were country A, country B, country C and country D.
Overall, there was more than
 Related Questions