
Please review my writing task 1. 21
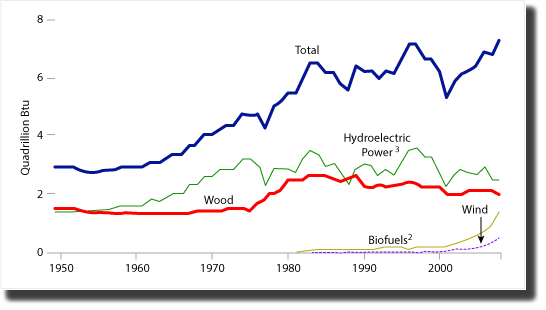
The diagram shows the consumption of renewable energy in the USA from 1949-2008.
The line chart illustrates firgures for the consumption using four different forms of renewable energy over a period of 59 years in the US.
Overall, the total of renewable energy is consumed more than doubled during the period shown. Notably, wood and hydroelectric power were the main sources of renewable energy in the US and there were no sources of biofuels and wind power between 1950 and 1980.
In 1950, about 1.5 quardrillion Btu of wood and hydroelectric power is consumed in the United States. Over the following 30 years, both sources increased considerably with some fluctuations and reached its peak, around 2 and 2.3 quardrillion Btu each. But by 2008, wood and hydroelectric power saw a small decline and reached to 1.8 and 2 quardrillions Btu respectively.
At the beginning of 1980, the consumption of these sources started emerging and showed a gradual rise to more than 5 times as much as the beginning period, around 1.0 and 0.5 quardrillions Btu respectively. In the year 2008, the total of renewable energy reached to about 8 quardrillions Btu.
Top answer
The diagram shows the consumption of renewable energy in the USA from 1949-2008. The line chart illustrates firgures for the consumption using four different forms of renewable energy over a period of 59 years in the US. Overall, the total of renewable energy is consumed more than doubled during the period shown.
- The diagram shows the consumption of renewable energy in the USA from 1949-2008.
- The line chart illustrates firgures for the consumption using four different forms of renewable energy over a period of 59 years in the US.
- Overall, the total of renewable energy is consumed more than doubled during the period shown.
- Notably, wood and hydroelectric power were the main sources of renewable energy in the US and there were no sources of biofuels and wind power between 1950 and 1980.
- 5 quardrillion Btu of wood and hydroelectric power is consumed in the United States.
Get the Weekly English Kit 📬
New words, one handy idiom, and a 2-minute quiz — delivered to your inbox to keep your streak alive.
The diagram shows the consumption of renewable energy in the USA from 1949-2008.
The line chart illustrates firgures for the consumption using four different forms of renewable energy over a period of 59 years in the US.
Overall, the total of renewable energy is consumed more than doubled during the period shown. Notably, wood and hydroelectric power were the main
 Related Questions