
Please review my writing task 1.
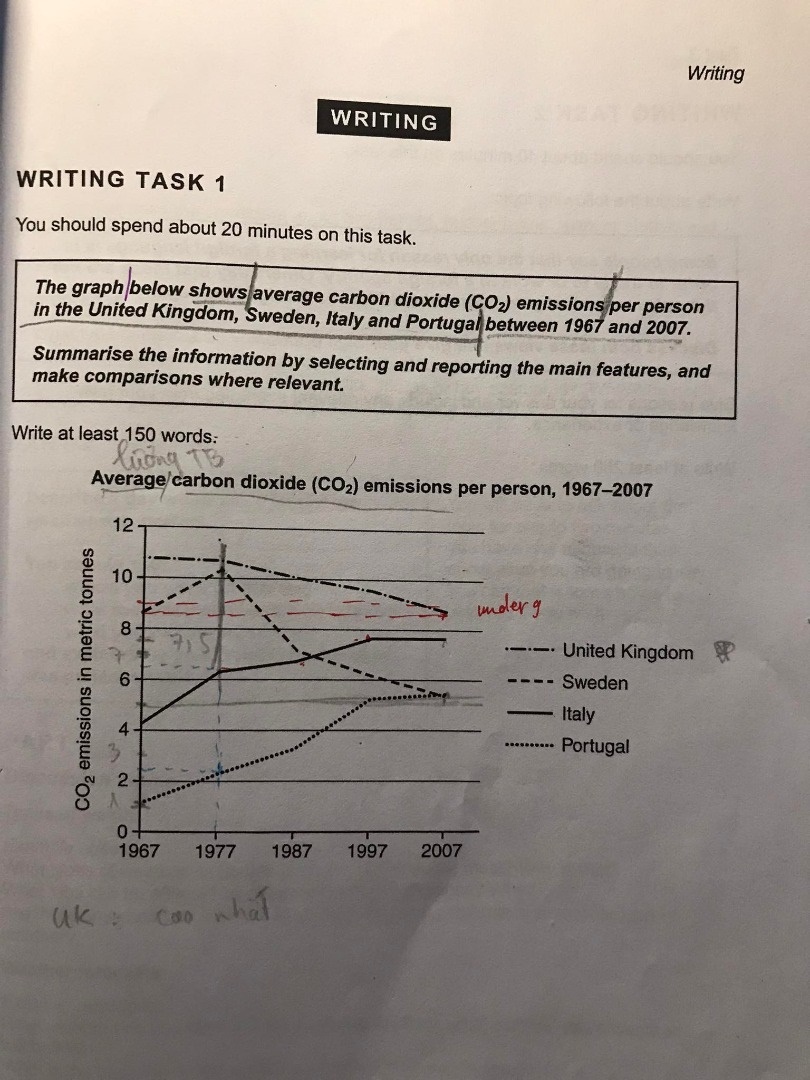
The line graph compares four different countries in terms of their per capita CO2 output from 1967 to 2007.
It is clear that there were significant changes in the amount of C02 released by each person in four nations shown on the graph. While the UK and Sweden saw C02 production fall over the 40-year period, the production of C02 in Italy and Portugal increased considerably.
Between 1967 and 1977, the amount of C02 produced by the average British person remained relatively stable, at around 11 tonnes. While, a dramatic increase was seen in C02 output in all three remaining countries, with the average production of C02 in Sweden reaching the peak of over 10 tonnes and the respective average amounts of C02 emissions in Italy and Portugal rising to 6.5 tonnes and 2.5 tonnes.
From 1977 to 2007, a UK person cut C02 production by roughly 2 tonnes, and Swedes reduced their C02 output by over 3 tonnes. By contrast, the average amount of C02 emitted by an Italian rose gradually to 7.5 tonnes in 1997, and stayed almost unchanged for the rest of the period shown. Portugal illustrated a similar pattern, with C02 the average production increasing to 5 tonnes in the year 1997, and stayed relatively stable during the last ten years.
Top answer
) in terms of their per capita CO2 output from 1967 to 2007. Better, more comprehensive first sentence. It is compact and efficient.
- ) in terms of their per capita CO2 output from 1967 to 2007.
- Better, more comprehensive first sentence.
- It is compact and efficient.
- That is a good quality for maths / science style of writing.
- Write key words to connect this paragraph to the body paragraphs.
Get the Weekly English Kit 📬
New words, one handy idiom, and a 2-minute quiz — delivered to your inbox to keep your streak alive.
The line graph compares four different countries (what countries?) in terms of their per capita CO2 output from 1967 to 2007.
Better, more comprehensive first sentence. It is compact and efficient. That is a good quality for maths / science style of writing. Write key words to con
Sample essay (~185 words)
Notes
1. The extensive comparisons in the detail paragraph. Do not focus on the individual curves, but the comparisons between the four curves on the graph.
2. The use of an abbreviation for the units of measure. The first time you write the units completely, indicate an abbreviation. Learn the methods of abbrev
 Related Questions