
Please review my Writing Task 1
Topic:
The bar chart below illustrates five different industries’ percentage share of Brazil’s economy in 2009 and 2019 with a forecast for 2029.
Summarise the information by selecting and reporting the main features, and make comparisons where relevant.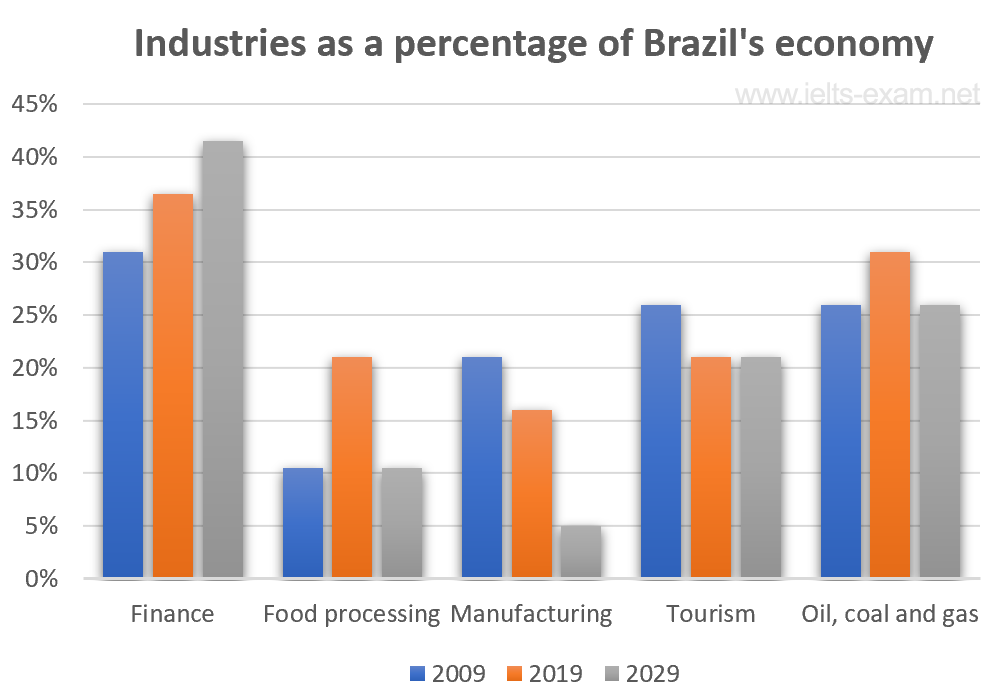
My answer:
The bar chart gives information on the proportion of five major industries: Finance, Food processing, Manufacturing, Tourism, Oil, coal and gas in the economy of Brazil from 2009 to 2019. It also predicts the figures of these sectors in 2029.
In general, it can be said that the trends are downward, with the exception of finance.
It is evident from the chart that, while figures for finance have risen significantly from over 30% in 2009 to roughly 37% by 2019, they are predicted to increase to about 43% in 2029. The reverse, however, was true for Manufacturing, with a decrease of 5% from 2009 to 2019 and an exponential drop of 10% expected in 2029. Between 2009 and 2019, Tourism figures decreased the same as Manufacturing, yet prediction shows these to be leveled off by 2029.
Top answer
Here is the essay I would write. This bar chart gives a proportional breakdown of Brazil's economy for five different sectors: finance, food processing, manufacturing, tourism, and energy, for two years, 2009 and 2019 with a prediction for 2029. Overall, the total percentages in 2009 and 2019 sum up to 113% and 126%, respectively.
- Here is the essay I would write.
- This bar chart gives a proportional breakdown of Brazil's economy for five different sectors: finance, food processing, manufacturing, tourism, and energy, for two years, 2009 and 2019 with a prediction for 2029.
- Overall, the total percentages in 2009 and 2019 sum up to 113% and 126%, respectively.
- And the forecast totals 104%.
- In addition, there are a number of sectors such as government, agriculture, medical, retail, and transportation, essential for any country's economy, that have not been included in the totals.
Get the Weekly English Kit 📬
New words, one handy idiom, and a 2-minute quiz — delivered to your inbox to keep your streak alive.
Here is the essay I would write.
This bar chart gives a proportional breakdown of Brazil's economy for five different sectors: finance, food processing, manufacturing, tourism, and energy, for two years, 2009 and 2019 with a prediction for 2029.
Overall, the total percentages in 2009 and 2019 sum up to 113% and 126%, respectively. And the forecast totals 104%. In addition, there ar
You wrote 136 words. That does not meet the minimum.
Please read my advice for misused words.
Do not use practice tests that are written by people who have failed all of their math classes, even in primary school!
The bar chart gives information on the proportion of five major industries: Finance, Food processing, Manufact
 Related Questions