
Please review my writing task 1
Please review my writing task 1. Thank you so much!!!
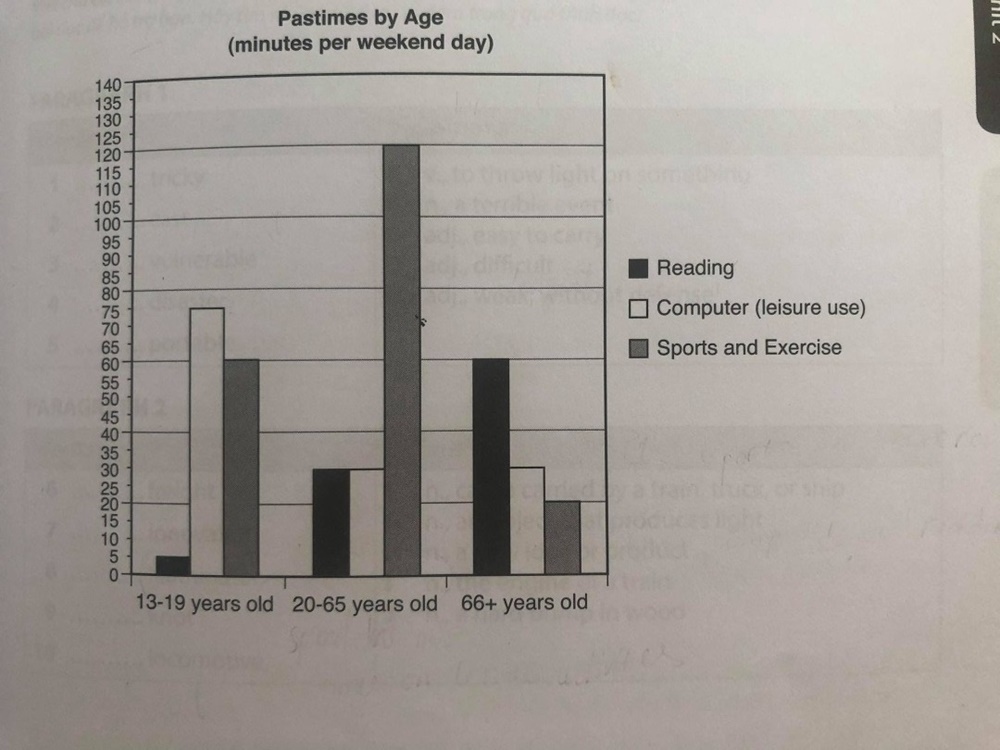
Topic: the bar graph below shows basic information about uses of leisure time among different age groups.
Summarize the information by selecting and reporting the main information and making comparisons.
My essay:
The bar graph illustrates the amount of time spent on various types of leisure activities of three distinct age groups. There are intellectual activities (computer use and reading) and physical activities (sport and exercise). The measurement unit is minutes per weekend day.
Overall, people aged 20 to 65 years old allocate more time for leisure pursuits than the younger and the elder groups (13-19 and 20-65 years old respectively) and most of their free time is for playing sports and doing exercise. People at the age of 66 and more spend most of their leisure time reading while the youngest group uses computers for a large portion of their free time.
In terms of physical activities, adults aged between 20 and 65 years old spend exactly 120 minutes per weekend day on sport and exercise which is six times higher than that of the older group(20 minutes) and two times higher than teenagers (60 minutes).
In terms of cognitive leisure, Reading consumes more free time than computer usage (60 and 30 minutes respectively) in the eldest group (66+ years old) while the opposite happens in teenagers (13-19 years old), they spend 75 minutes using the computer and 5 minutes reading. Adults aged from 20 to 65 years old give equal time for both reading and computer usage (30 minutes).
Top answer
Your essay is too long, nearly 225 words. Aim for 170-190 for Task 1. The bar graph illustrates (wrong word - illustrate is for diagrams, pictures, maps, that is, those with a drawing or photograph.
- Your essay is too long, nearly 225 words.
- Aim for 170-190 for Task 1.
- The bar graph illustrates (wrong word - illustrate is for diagrams, pictures, maps, that is, those with a drawing or photograph.
- It is not for mathematical plots.
- ) the amount of time spent in minutes on Saturdays and Sundays on various types of leisure activities of by three distinct age groups.
Get the Weekly English Kit 📬
New words, one handy idiom, and a 2-minute quiz — delivered to your inbox to keep your streak alive.
Your essay is too long, nearly 225 words. Aim for 170-190 for Task 1.
The bar graph illustrates (wrong word - illustrate is for diagrams, pictures, maps, that is, those with a drawing or photograph. It is not for mathematical plots. ) the amount of time spent in minutes on Saturdays and Sundays
Sample essay:
The clustered bar chart gives the number of minutes spent during the weekends on three types of activities divided into three age groups. The activities are reading, computer use, and sports and the age groups are teenagers (13-19) adults (20-65) and seniors (66+).
Overall, adults spent the largest amount of time on these activities, followed by teenagers and the
 Related Questions