
Please Review My Writing Task 1
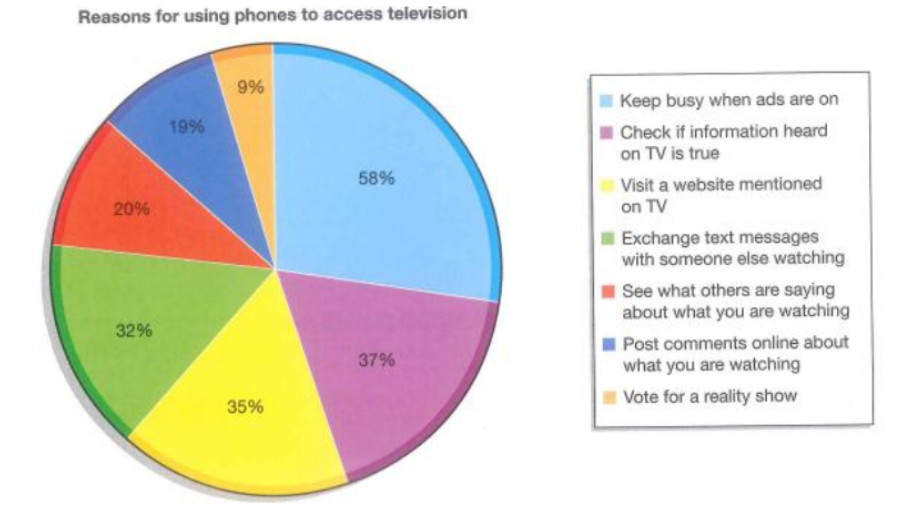
The pie chart depicts the percentage of people who connect to television using their mobile phones for seven particular reasons.
Overall, more than a half of the people being surveyed use phones to keep themselves busy while waiting for the ads to end. However, only a small proportion of people take advantage of cellphones by exchanging their thoughts with others on social media or voting for a reality show.
It is obvious that the percentage of people using phones in order not to watch the ads dominates the chart, with 58% respectively. On the other hand, over one-third of people using their phones concentrate on what is being broadcasted with 37% desire to certify the data on TV, 35% enter websites indicated on TV and 32% communicate with other viewers.
As it is reported, around one-fifth of viewers use phones so as to follow others’ discussions and share their own opinions of what they are observing on TV. Only 9% of people use their phones to vote for reality shows.
Top answer
[ 1] The pie chart depicts compares seven different reasons people used their phones in relation with TV programs. the percentage of people who connect to television using their mobile phones for seven particular reasons. [ 2] Overall, more than a half of the people [ 3] being surveyed use phones to keep themselves busy while waiting for the a ds on TV to end.
- [ 1] The pie chart depicts compares seven different reasons people used their phones in relation with TV programs.
- the percentage of people who connect to television using their mobile phones for seven particular reasons.
- [ 2] Overall, more than a half of the people [ 3] being surveyed use phones to keep themselves busy while waiting for the a ds on TV to end.
- However, only a minority [ 4] small proportion of people take advantage of [ 5] smartphones cellphones by exchanging their thoughts with others on social media or voting to vote for a reality show.
- It is obvious that the percentage of people using phones in order not to watch the ads on TV dominates the chart, with 58% .
Get the Weekly English Kit 📬
New words, one handy idiom, and a 2-minute quiz — delivered to your inbox to keep your streak alive.
[ 1]
The pie chart depicts compares seven different reasons people used their phones in relation with TV programs. the percentage of people who connect to television using their mobile phones for seven particular reasons. [ 2]
 Related Questions