
Please review my writing task 1.
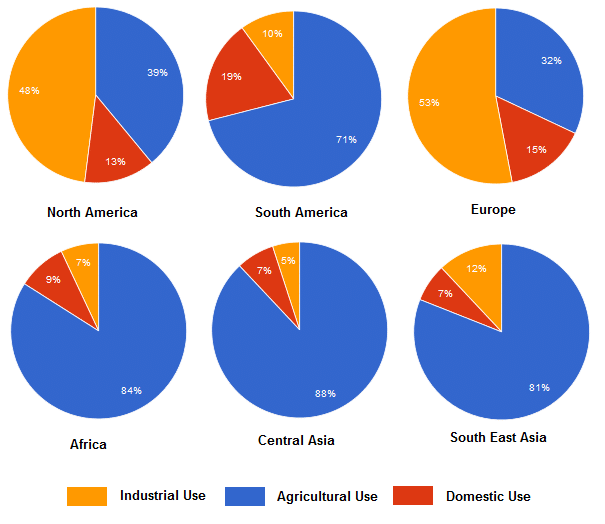
The charts below show the percentage of water used for different purposes in six areas of the world.
Summarise the information by selecting and reporting the main features and make comparisons where relevant.
The pie charts compare the proportion of water consumption for industrial, agricultural and domestic in six different places in the world.
Overall, more water is consumed by industrial in North America and Europe. By contrast, agriculture is by far the most popular of water usage in four other areas in the world.
In North America and Europe, industrial use accounts for about a half of water consumption in both places, about 48% and 53% respectively. The firgure for domestic water consumption is the lowest percentage, just more than one in ten in two areas.While about 39% water used for agriculture in North America, the firgure for Europe is 7% lower, at 32%.
Regarding the other regions, most water is used for agriculture, with the highest percentage belonging to Central Asia at 88%. The opposite trend can be seen from industrial and domestic water consumption, just under 30% of the total of 2 categories. While water used for residents is the lowest percentage in South East Asia, at 7%, the trend can be seen from industry in the rest of three places.
Top answer
The pie charts compare the proportion of water used consumption for industrial, agricultural and domestic (Those words are adjectives. You must have a noun after them) purposes in six different places (wrong word. A place can be a city or address.
- The pie charts compare the proportion of water used consumption for industrial, agricultural and domestic (Those words are adjectives.
- You must have a noun after them) purposes in six different places (wrong word.
- A place can be a city or address.
- These are regions or areas.
- ) in the world.
Get the Weekly English Kit 📬
New words, one handy idiom, and a 2-minute quiz — delivered to your inbox to keep your streak alive.
The pie charts compare the proportion of water used consumption for industrial, agricultural and domestic (Those words are adjectives. You must have a noun after them) purposes in six different places (wrong word. A place can be a city or ad
 Related Questions