
Please review my writing task 1.
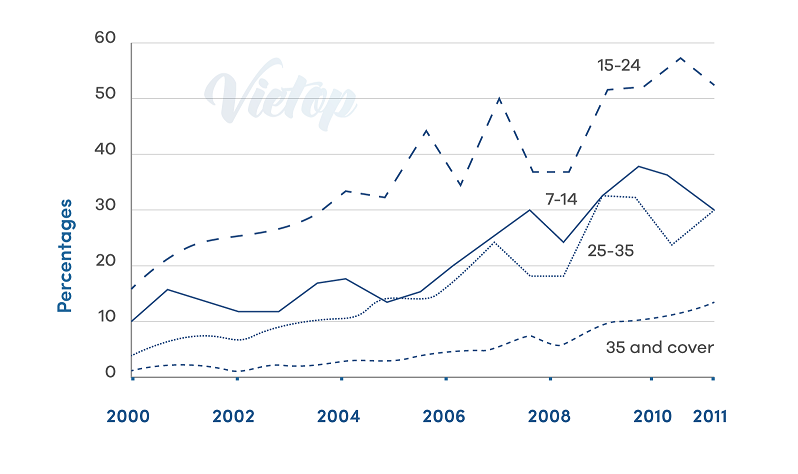
The chart below shows the percentage of people of different age groups who went to cinema once a month or more in one European country from 2000 to 2011.
The line graph compares the proportion of residents of a certain country in Europe, who went to cinema once or more than once a month over the 11 years (2000-2011). They are divided into four age brackets: the children (7-14), the young (15-24), adults (25-35) and older adults (35 and cover).
Overall, the rates of cinema attendance for all ages increased between 2000 and 2011, despite the fluctuation in between. The percentage of people going to the cinema from 15-24 years old was highest, whereas the lowest rate for cinema’s attendees was recorded for older adults during the period shown.
In 2000, around 15% of the young people (15-24) went to the cinema once a month or more, which made up the largest proportion in this period. The figure increased more than tripple to 52% in 2011, though there was a small drop in 2006 and 2008. By contrast, the older adults had a negligible amount, only 2% in 2000 and rose slightly by 10 % over the 11-year period.
In 2000, the 7-14 and 25-35 of the cinema’s attendees spent once more time were 10% and 5% respectively. There was a great fluctuation in both groups over the period shown, before reaching 30% in 2011.
Top answer
The line graph compares the proportio n s of residents of a certain country in Europ e who went to the cinema once or more than at least once a month over the 1 2 years (2000-2011). They are divided into F our age brackets: the groups are compared: children (7-14), the young (15-24), adults (25-35) and older adults (35 and cover). Overall, the rates of cinema attendance for all ages increased between 2000 and 2011, despite the some fluctuation in between.
- The line graph compares the proportio n s of residents of a certain country in Europ e who went to the cinema once or more than at least once a month over the 1 2 years (2000-2011).
- They are divided into F our age brackets: the groups are compared: children (7-14), the young (15-24), adults (25-35) and older adults (35 and cover).
- Overall, the rates of cinema attendance for all ages increased between 2000 and 2011, despite the some fluctuation in between.
- The percentage of people 15-24 years old going to the cinema from 15-24 years old was highest throughout that period , whereas the lowest rate for cinem a a ttendees was recorded for older adults.
- during the period shown.
Get the Weekly English Kit 📬
New words, one handy idiom, and a 2-minute quiz — delivered to your inbox to keep your streak alive.
The line graph compares the proportions of residents of a certain country in Europe who went to the cinema once or more than at least once a month over the 1
 Related Questions