
Please review my writing ielts task 1
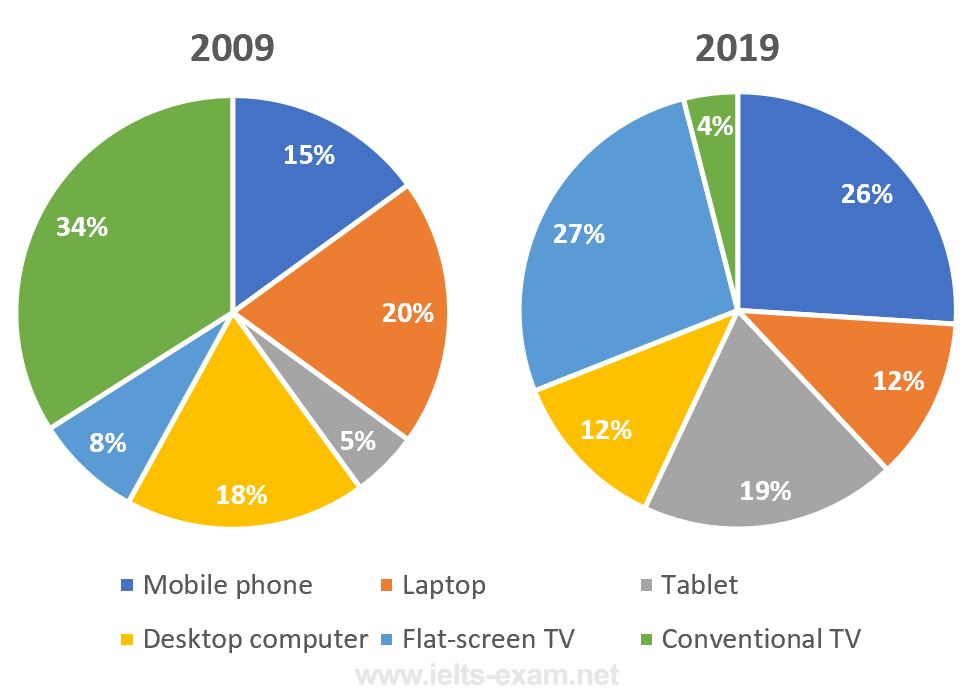
The pie charts compare the proportion of people in 18-25-year-olds using different devices to watch television in Canada in 2009 and 2019.
Overall, conventional TV was used by the highest number of Canadian people in the 18 to 25 age group in 2009, while mobile phone and flat-screen TV were much more popular among Canadians in that age bracket in 2019.
In 2009, just over a third of young Canadians used conventional TV, which was nearly double the percentage of desktop computer usage. Ranked second was "laptop" with 20% of usage, 5% higher than that of "mobile phone". Flat-screen TV and tablet were less popular among youngsters at this time, at 8% and 5%, respectively.
However, in 2019, youngsters in Canada hardly used conventional TV, accounting for only 4% of usage. Instead, flat-screen TV became more well-liked, at 27%, followed by mobile phone, with 26%. Tablet was also a relatively favored device among young Canadians, at 19%. Meanwhile, the proportion of the young using desktop computer and laptop to watch TV was the same, with 12% of each.
Top answer
I have ask you several times before to post essays in the writing forum. Please post essays, paragraphs, dialogues and other writing in the essay forum so a moderator does not have to move your post. Click on this link: Next, tap on the green button "write a new post"
- I have ask you several times before to post essays in the writing forum.
- Please post essays, paragraphs, dialogues and other writing in the essay forum so a moderator does not have to move your post.
- Click on this link: Next, tap on the green button "write a new post"
Get the Weekly English Kit 📬
New words, one handy idiom, and a 2-minute quiz — delivered to your inbox to keep your streak alive.
I have ask you several times before to post essays in the writing forum.
Please post essays, paragraphs, dialogues and other writing in the essay forum so a moderator does not have to move your post. Click on this link: Next, tap on the green button "write a new post"
Please include the Task instructions so we don't have to go searching on the internet for them.
The pie charts below show the devices people in the 18 to 25 age group use to watch television in Canada in two different years.
Summarise the information by selecting and reporting the main features, and make comparisons where relevant.
You must learn how to combine categories if you want a high score. Just copying numbers from the figure will not yield a good mark.
The pie charts compare the proportion of people in 18-25-year-olds using different devices to watch television in Canada in 2009 and 2019. (What are the devices? How many choices are there?)
Sample essay
The two pie charts, 2009 and 2019, divide the total population of young Canadian adults (18-25) into groups based on what devices they use to watch TV. Six different devices are shown: conventional TV, flat screen TV, desktop computer, laptop, tablet and mobile phone.
Overall, in 2009, TV sets were the first choice for these viewers, with laptop computers being secon
 Related Questions