
Please review my writing ielts task 1
The line graph compares the number of people who visited different museums over a 36-year period.
Overall, there was a significant increase in the number of visitors to Vatican Museums and Louvre, while a reverse pattern was observed in London Museum and Shenzen Museum. In addition, Lourve was the most popular museum of the four museums.
In 1980, just over 8 million visitors came to Louvre. Ranked second was Vatican Museums with nearly 5 million visitors, followed by London Science Museum, with slightly over 4 million visitors. Shenzen Museum was the least popular among visitors, only under 4 million.
During the period of 36 years, Vatican Museum saw the most dramatic rise in the number of visitors to just over 9000 million in 2015. The figure for Louvre showed a similar trend, rising to nearly 10 million visitors in the same period. By contrast, London Science Museum witnessed a remarkable decrease to a low of around 2 million visitors in 2015 despite a stable period between 1980 and 1985. The number of visitors to Shenzen Museum fell gradually by approximately 1 million in 1995 before rising back to nearly 4 million by the end of the period.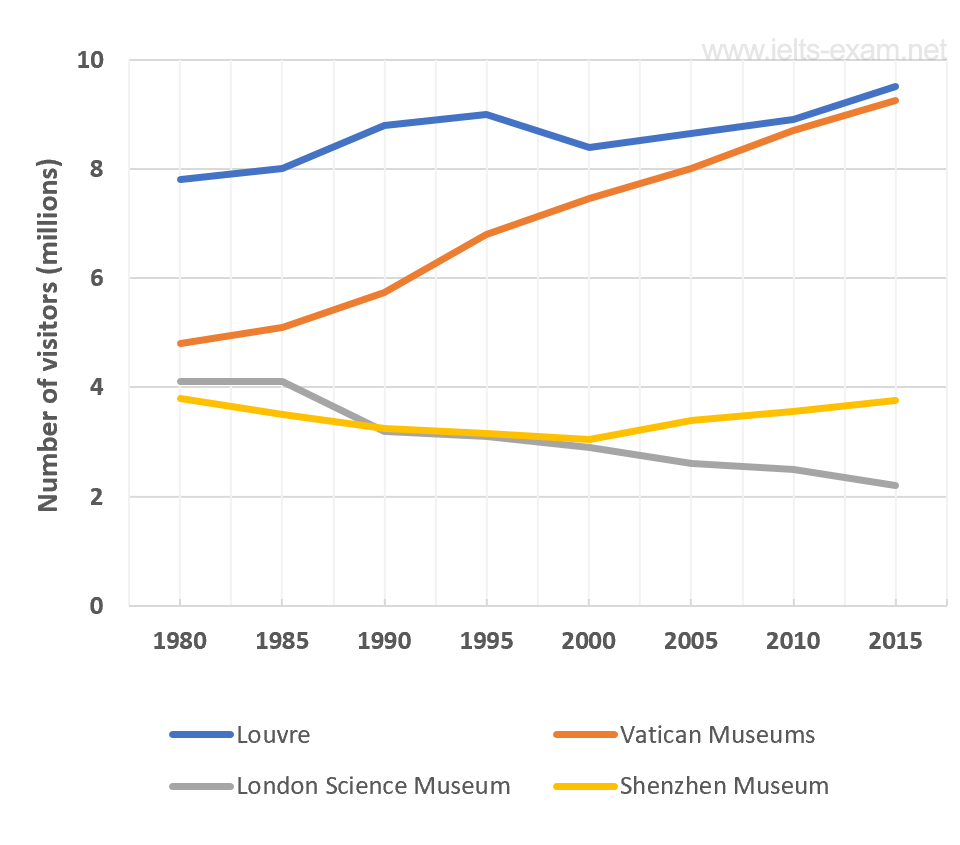
Top answer
Please post essays, paragraphs, dialogues and other writing in the essay forum so a moderator does not have to move your post. Click on this link: Next, tap on the green button "write a new post" Please read my advice for Task 1 essays: IELTS TASK 1: Hints, Tips And Advice Vocabulary Words For Task 1: Reference Post
- Please post essays, paragraphs, dialogues and other writing in the essay forum so a moderator does not have to move your post.
- Click on this link: Next, tap on the green button "write a new post" Please read my advice for Task 1 essays: IELTS TASK 1: Hints, Tips And Advice Vocabulary Words For Task 1: Reference Post
Get the Weekly English Kit 📬
New words, one handy idiom, and a 2-minute quiz — delivered to your inbox to keep your streak alive.
The line graph compares the number of people who visited different museums over a 36-year period. (Your first paragraph is woefully inadequate. Was this 36-year period from 1900-1935 or 1880-1915, or something else? How many museums are shown - 5 or 20? What are their names?)
Overall, there was a significant increase in the numbe
Sample Essay. This essay is too long, but will give you some ideas of phrasing and how to combine categories. To get the highest score, you should make logical combinations. In this case, I added up the totals at the beginning and end of the period, and computed two percentages for comparison.
The line graph plots the numbers of people who visited four well-known museums (the London
 Related Questions