
Please review my writing ielts task 1
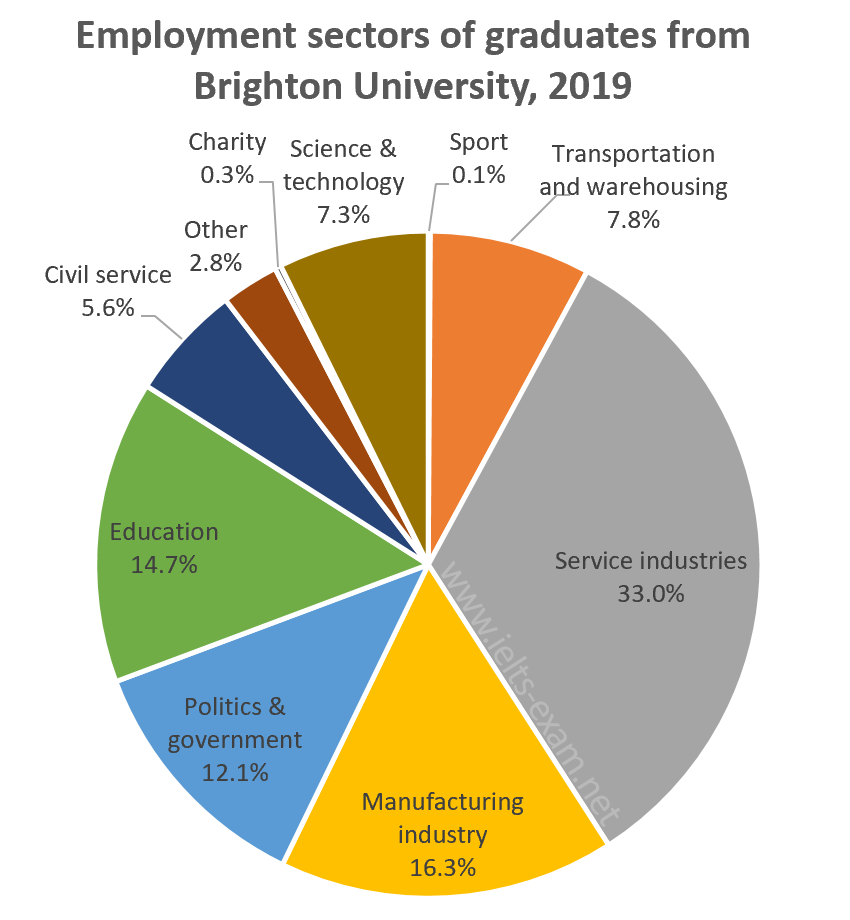
The pie chart provides information about the percentages of students who graduated from Brighton University regarding their options for various employment sectors in 2019.
Overall, the service industries sector attracted the largest amount of students after finishing university. The sport sector, on the other hand, accounted for the lowest proportion of the total.
In 2019, a third of graduates entered the service industries sector, which was nearly double the percentage of the manufacturing industry one, at 16.3%. The education sector also remained a relatively important choice among graduates, at 14.7%. This was 2.6% higher than the proportion of the politics and government sector.
Meanwhile, only 7.8% of graduates opted for entering the transportation and warehousing sector, followed by the science and technology one with 7.3%. The civil service sector accounted for 5.6%, which was exactly double the proportion of the unspecified sector. The least popular choices were in the charitable and sport sectors, both of which were chosen by under 1% of graduates.
Top answer
The pie chart provides information about outlines the percentages of students who graduated from Brighton University graduates who got employed in regarding their options for various employment sectors in 2019. [ 1] Overall, the service industries sector attracted the largest amount proportion/number of graduates, whereas students after finishing university. t he sport sector, on the other hand, accounted for the lowest proportion of the total.
- The pie chart provides information about outlines the percentages of students who graduated from Brighton University graduates who got employed in regarding their options for various employment sectors in 2019.
- [ 1] Overall, the service industries sector attracted the largest amount proportion/number of graduates, whereas students after finishing university.
- t he sport sector, on the other hand, accounted for the lowest proportion of the total.
- 3%.
- 7%.
Get the Weekly English Kit 📬
New words, one handy idiom, and a 2-minute quiz — delivered to your inbox to keep your streak alive.
The pie chart provides information about outlines the percentages of students who graduated from Brighton University graduates who got employed in regarding their options for various employment sectors in 2019.
[ 1]
Overall, the service industries
 Related Questions