
Please review my writing ielts task 1
The line graph provides data about the number of men and women who enrolled in gym clubs over a 31-year period from 1980 to 2010.
Overall, the number of male and female members fluctuated during the period shown. In addition, the figures for men were higher than those for women.
In 1980, male gym membership began at just over 2000, which doubled the figure for female members, at slightly over 1000. There was then a steady increase in the number of male members to nearly 4000 in 1985 before falling to a low of approximately 1600 in 1995. Also, female rates showed an upward trend in the same period, rising to just over 3000 in 1995.
However, the number of men witnessed a significant rise to reach a peak of 5000 between 2000 and 2005 and then declined sharply to a record low of nearly 600 in 2012. By contrast, there were fluctuations in female rates during the same period. By the end of the period, the figure for females was nearly 2000, which was three times more than males.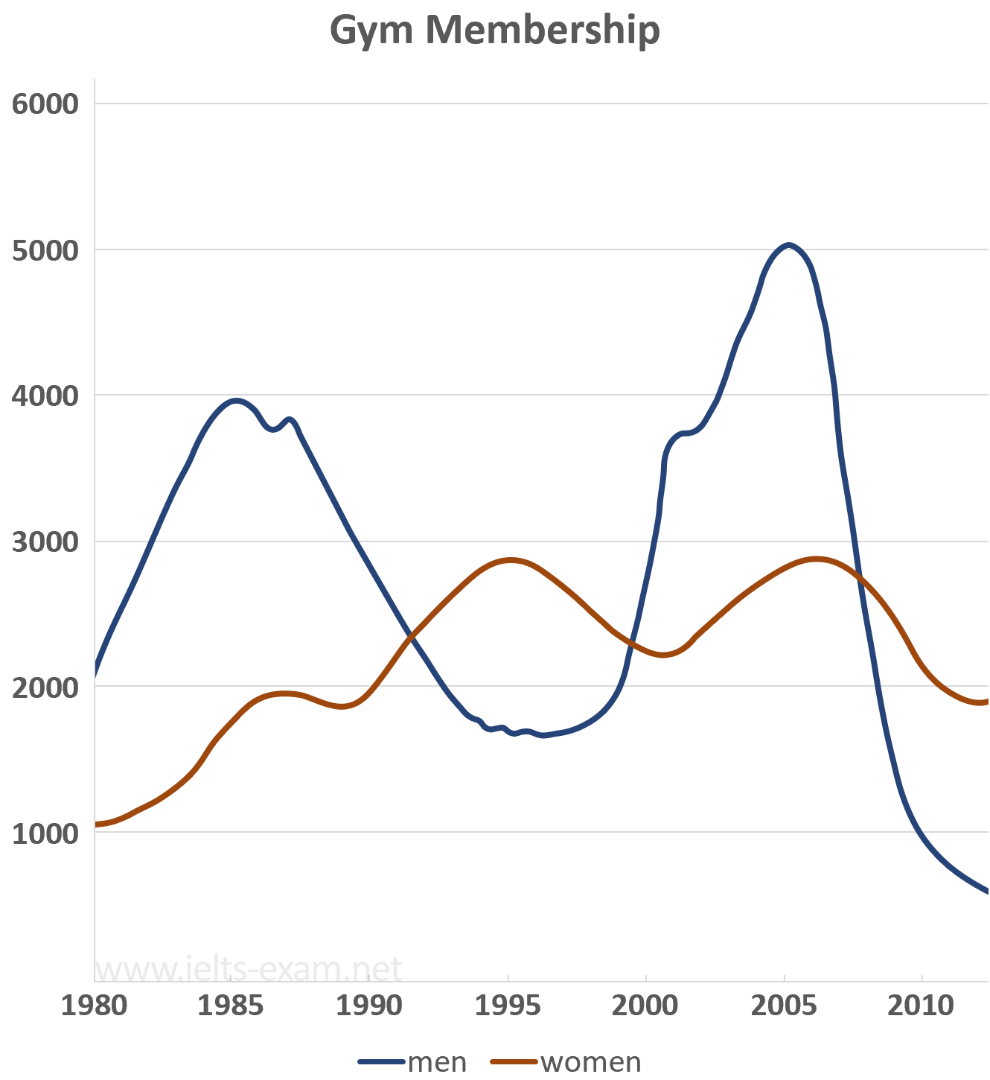
Top answer
I have highlighted the words or expressions that are not used properly. The patterns on this graph are not really fluctuations, but variations. If you write about fluctuations you must describe a trend line, because fluctuations are variations on an underlying trend.
- I have highlighted the words or expressions that are not used properly.
- The patterns on this graph are not really fluctuations, but variations.
- If you write about fluctuations you must describe a trend line, because fluctuations are variations on an underlying trend.
- To learn the word 'fluctuation" read my advice.
- " If you would like a sample essay, please ask.
Get the Weekly English Kit 📬
New words, one handy idiom, and a 2-minute quiz — delivered to your inbox to keep your streak alive.
I have highlighted the words or expressions that are not used properly.
The patterns on this graph are not really fluctuations, but variations. If you write about fluctuations you must describe a trend line, because fluctuations are variations on an underlying trend. To learn the word 'fluctuation" read my advice. It also describes misused words "figure," "peak" and "rate." If you wou
 Related Questions