
Please review my writing IELTS task 1
Topic: The table gives information about five types of vehicles registered in Australia in 2010, 2012, and 2014.
My essay:
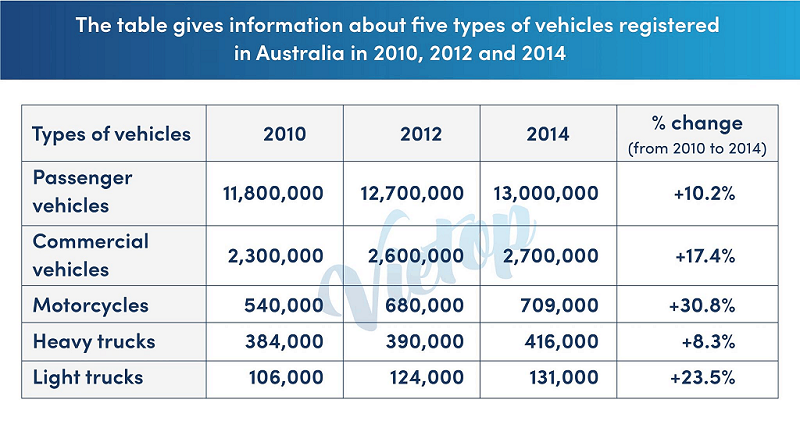
The table compares the number of five means of transport that were registered in Australia in three different years 2010, 2012, and 2014.
Overall, It can be seen that there was a dramatic rise in the number of all registered vehicles over the period shown. The biggest change was witnessed in the motorcycles, which was opposite to the heavy trucks.
In 2010, The number of passenger vehicles registered was the highest, at 11,800,000 vehicles, which was reserve in light trucks, at 106,000 vehicles. Exactly 2,300,000 vehicles was registered by commercial, while just only 540,000 and 384,000 vehicles was obtained by motorcycles and heavy trucks, respectively.
All kinds of transport had an upward trend from 2010 to 2014. In particular, the figure for motorcycles grew remarkably to 709,000 vehicles, which makes it accounted for 30.8% of the change. Similarly, the data for passenger vehicles, commercial vehicles, and light trucks went to grammatically 13,000,000, 2,700,000, and 131,000 vehicles, respectively and took 10.2%, 17.4%, and 23,5% in the changes, respectively. Regarding heavy trucks number registered, it saw a much slower growth, with having 416,000 vehicles, a rise of 8.3%.
Top answer
The table compares the number of five means of transport ( Ships, bicycles and trains are means of transport. Are these in the table? ) that were registered in Australia in three different years 2010, 2012, and 2014.
- The table compares the number of five means of transport ( Ships, bicycles and trains are means of transport.
- Are these in the table?
- ) that were registered in Australia in three different years 2010, 2012, and 2014.
- (Your first paragraph is incomplete.
- Overall, It can be seen that (Those words are useless.
Get the Weekly English Kit 📬
New words, one handy idiom, and a 2-minute quiz — delivered to your inbox to keep your streak alive.
The table compares the number of five means of transport (Ships, bicycles and trains are means of transport. Are these in the table? You need to be very specific.) that were registered in Australia in three different years 2010, 2012, and 2014. (Your first paragraph is incomplete.
Overall, It can be seen that (Tho
 Related Questions