
Please review my Task 1 Writing
Hi
Please review this IELTS Task 1 Writing
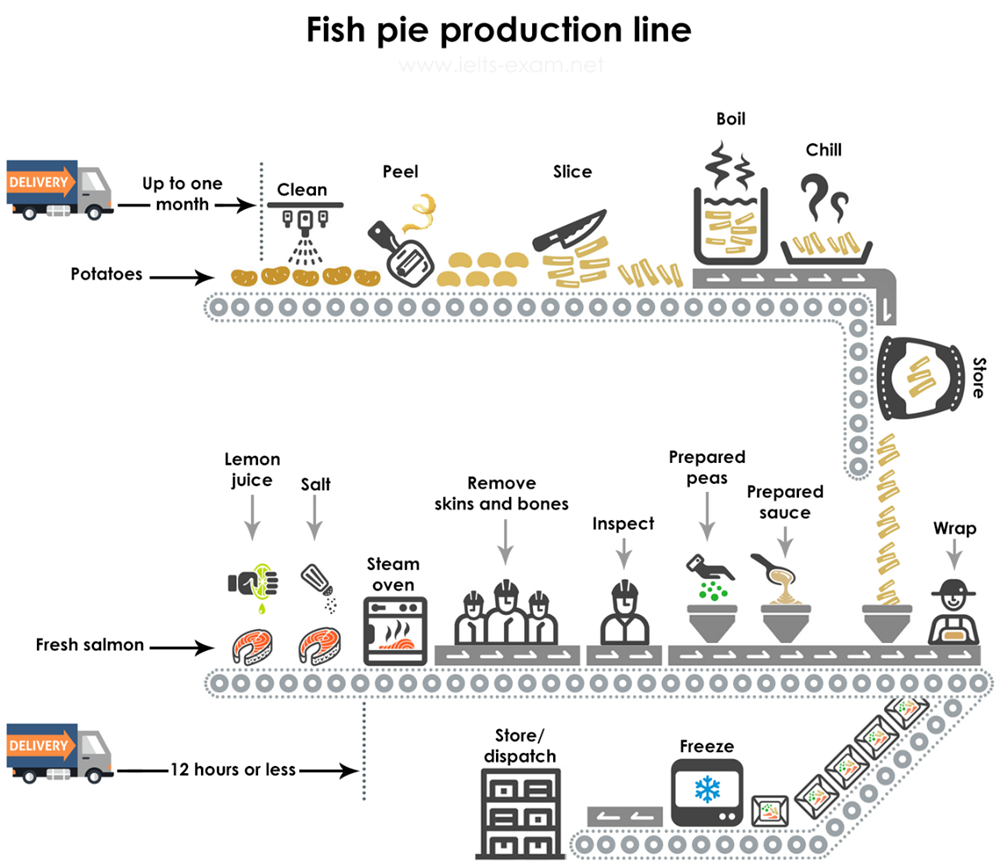
The diagram illustrates the process of manufacturing frozen fish pie.
One series of processes produce potato French chips, the final ingredient. and the other gets the fish ready for the pie. While the former is a simple process, the latter is a labor intensive and elaborate one.
Potatoes reach the production line almost a month early, but whereas fish is brought there not later than twelve hours. Potatoes are thoroughly cleaned, peeled and sliced for finger chips. They are boiled, chilled and moved to the store. Unlike the potatoes, which are cleaned with water, fish is cleaned using lemon juice and salt before being steamed in the oven. It goes for visual inspection after the skin and bones are removed. Thereafter, peas, sauce, and potato finger chips are added to it. The pie is wrapped and stored in the freezer from where it will be dispatched to the wholesale and retail outlets.
Suresh
Top answer
The diagram is faulty. Chips are not used in fish pie, but mashed potatoes are the top crust. The step to mash the boiled potatoes, mixing in some milk and butter, is missing.
- The diagram is faulty.
- Chips are not used in fish pie, but mashed potatoes are the top crust.
- The step to mash the boiled potatoes, mixing in some milk and butter, is missing.
Get the Weekly English Kit 📬
New words, one handy idiom, and a 2-minute quiz — delivered to your inbox to keep your streak alive.
It is not your fault that the description is not correct. The diagram is quite misleading and flawed.
The diagram illustrates the process of manufacturing frozen fish pies.
One series of processes produce potato French chips, the final ingredient. and the other gets the fish ready f
Hellp
Please review this IELTS Task 1 Writing
The rendered chart illustrates the percentage of electric appliances holded by the households and the time spent to do the housework. And, how it varies in time being from the year 1920 to 2019
Firstly , we can observe there are different electrical appliances like washing machine, refrigerator and vaccum cleaner.In the year
Hello , Please review my ielts task 1
The chart below show the changes in ownership of electrical appliances and amount of time spent doing housework in housholds in one country between 1920 and 2019
The renered chart illustrate the percentage of electric appliances holded by the households and the time spent to do the house work . And, how it varies in time being from the yea
 Related Questions