
Please Review My Task 1 IELTS Essay
Question:
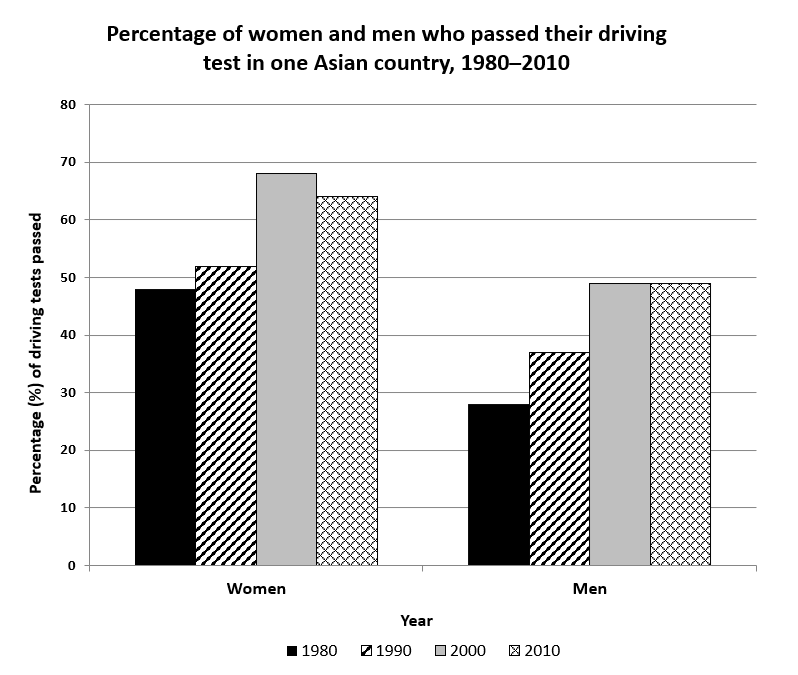
The chart shows the percentage of women and men in one Asian country who passed when they took their driving test between 1980 and 2010.
Summarise the information by selecting and reporting the main features, and make comparisons where relevant.
The bar chart illustrates the passing rate of males and females in their driving test in one Asian nation from 1980 to 2010.
Overall, the percentage of women who qualified for the driving test was higher than that of men. Both the rate of men and women rose steadily throughout the period.
In 1980, women who passed the driving test reached under 50%. After a slight growth in 1990 to over 50%, it then increased rapidly until reaching its peak in 2000 at nearly 70%. After that, it fell slightly to approximately 60% in 2010.
On the other hand, the men who succeeded in the test accounted for almost 30% in 1980 before a fast-growing to nearly 40% and 50% in 1990 and 2000, respectively. After that, it remained constant at roughly 50% in the next ten years, which was nearly equal to the proportion of women in 1980 and 1990.
Top answer
The bar chart illustrates (wrong word choice. ) . the passing rate Rates are different from percentages.
- The bar chart illustrates (wrong word choice.
- ) .
- the passing rate Rates are different from percentages.
- Read my advice.
- ) of males and females in their driving test in one Asian nation from 1980 to 2010 .
Get the Weekly English Kit 📬
New words, one handy idiom, and a 2-minute quiz — delivered to your inbox to keep your streak alive.
The bar chart illustrates (wrong word choice. Read my advice.) . the passing rate Rates are different from percentages. Read my advice. Do not use synonyms for the measurement.) of males and females in their driving test in one Asian nation from 19
 Related Questions