
Please review my task 1 essay. Thank you.
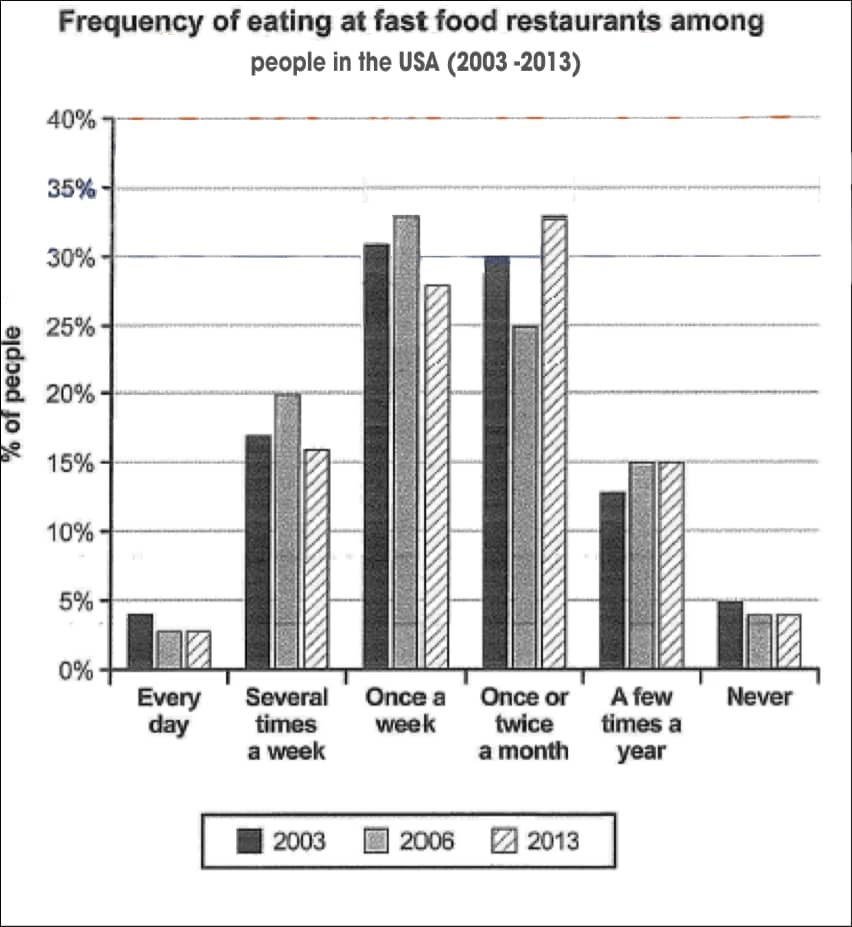
The bar chart depicts the frequency of eating fast food by American people between 2003 and 2013.
Overall, it can be clearly seen that the people who ate fast food once a week to once or twice a month, are the most fast food consumers. Just a very small proportion ate fast food every day or never ate it. About one third of the people consume fast food rarely or usually.
As shown, the most fast food eaters, those who ate it once a week and once or twice a month, had the same percentage in average, about 30%. The most obvious difference between these two groups is that at first, once a week goruop increased and then increased over this period. While, those who ate one or two times a month, had the reverse trend.
Every day consumers and the people who never consumed fast food, were almost the same. In total, they made up about 10 % of the whole. Also, the rest two group () had similar trends. The difference is that the proportion of people who ate several times a week, increased by 20% and then declined just over 15%. Whereas, those who ate rarely, increased by 15% and their proportion stayed constant until 2013.
Top answer
The bar chart depicts the frequency of eating fast food by American people between 2003 and 2013. ) Overall, it can be clearly seen that the people who ate fast food once a week to once or twice a month, are the most fast food consumers . (wrong expression) Just a very small proportion ate fast food every day or never ate it.
- The bar chart depicts the frequency of eating fast food by American people between 2003 and 2013.
- ) Overall, it can be clearly seen that the people who ate fast food once a week to once or twice a month, are the most fast food consumers .
- (wrong expression) Just a very small proportion ate fast food every day or never ate it.
- About one third of the people consume fast food rarely or usually .
- (vague, imprecise) As shown, the most fast food eaters, those who ate it once a week and once or twice a month, had the same percentage in average, about 30%.
Get the Weekly English Kit 📬
New words, one handy idiom, and a 2-minute quiz — delivered to your inbox to keep your streak alive.
The bar chart depicts the frequency of eating fast food by American people between 2003 and 2013. (Inadequate introductory paragraph.)
Overall, it can be clearly seen that the people who ate fast food once a week to once or twice a month, are the most fast food consumers. (wrong expression) Just a very small proport
 Related Questions