
Please review my task 1 essay (BAR)
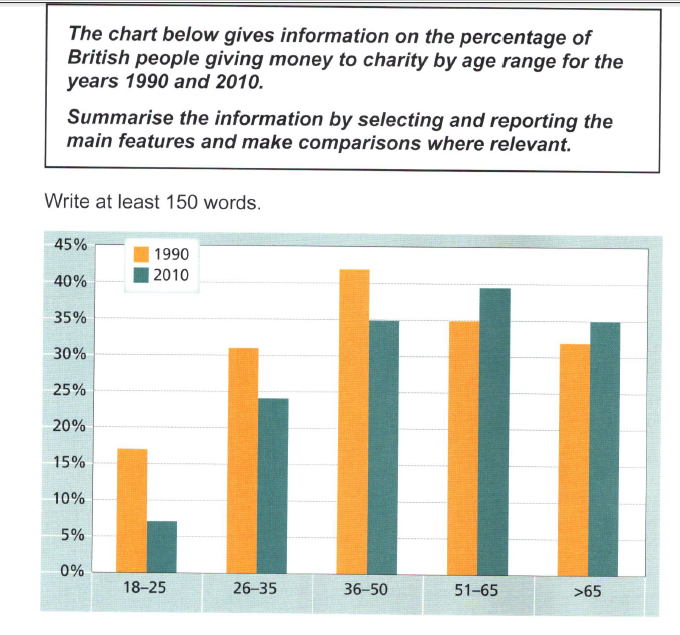
The bar graph shows the amount of money to charity by five different age groups in the UK in 1990 and 2010.
Overall, the middle age gave money to the poor more than the other age group. By contrast, there was a rise in British people aged over 65, while the younger British given money to charity was much less in 2010.
Just over 40% of people in Britain aged 36-50 spent on charity, which was by far the highest in 1990. However, this amount fell by around 5% in 2010 and was the same at over 66 and more aged group. The figures for the British’s charity saw gradual growth in 51-65 and over 66 age group, at just under 40% and 35% respectively.
By 1990, the amount of money on charity recorded the lowest on the youngest group (about 17%), and a little above 5% was shown on the graph. The percentage of the money in the 26-35 group almost doubled those of the 18-25 group, while around 25% of the money gave to the poor saw in 2010.
Top answer
The bar graph shows the amount of money to charity by five different age groups in the UK in 1990 and 2010. Overall, the middle age gave money to the poor more than the other age group. By contrast, there was a rise in British people aged over 65, while the younger British given money to charity was much less in 2010.
- The bar graph shows the amount of money to charity by five different age groups in the UK in 1990 and 2010.
- Overall, the middle age gave money to the poor more than the other age group.
- By contrast, there was a rise in British people aged over 65, while the younger British given money to charity was much less in 2010.
- Just over 40% of people in Britain aged 36-50 spent on charity, which was by far the highest in 1990.
- However, this amount fell by around 5% in 2010 and was the same at over 66 and more aged group.
Get the Weekly English Kit 📬
New words, one handy idiom, and a 2-minute quiz — delivered to your inbox to keep your streak alive.
The bar graph shows the amount of money to charity by five different age groups in the UK in 1990 and 2010.
Overall, the middle age gave money to the poor more than the other age group. By contrast, there was a rise in British people aged over 65, while the younger British given money to charity was much less in 2010.
Just over 40% of people in Britain aged 36-50 spent on charity,
 Related Questions