
Please review my task 1 essay
Topic: The graph below shows how money was spent on different forms of entertainment over a five year period.
My essay:
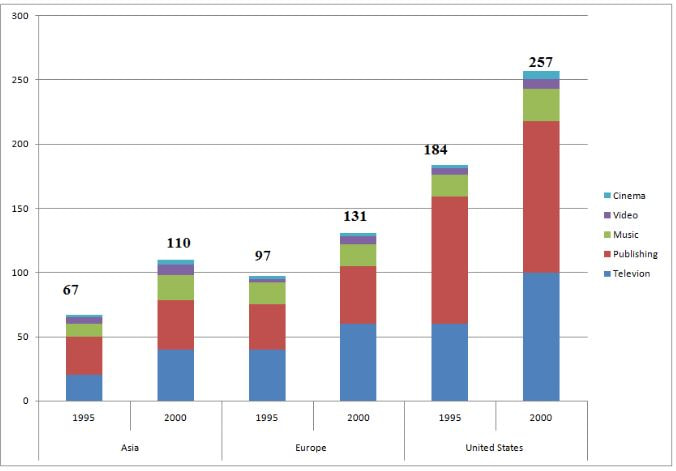
The bar chart compares two continents, namely Asia and Europe and United States in terms of the expenditure on five different types of recreational acitivities between 1995 and 2000 . The categories include cinema, video, music, publishing and television.
In general, an upward trend was obsered for the money allocation for entertainment across all places. Additionally, America’s total expense on entertainment was higher than that of two remainders and publishing accounted for the largest budget compared to cinema and video over the period.
In 1995, a total of 67 billion was spent on entertainment by Asian nations, half of which was expensed on pubilishing, television compared to a neglible budget for cinema. The total amonut had a nealy twofold increase after 5 years, with each form doubling respectively.
In Europe, 97.000 million dollars was spent on entertainment in 1995, with 40 billion on TV, publishing and 20 billion on music. Video and cinema recorded very insignificant growths in expense by 2000, while television and publishing rose steeply and the total reached a peak of 131 billion dollars invested in fun.
In America, in 1995, people spent more than 50 billion on TV and more than 70.000 million on publishing. Music, video and cinema had changed slightly by 2000. After 5 years, the bar chart reached a new high of 257 billion, because the TV fun and publishing increased to 100 and 110 billion respectively.
Top answer
Your essay, 233 words, is way too long. Aim for 170-190 words for Task 1. Three paragraphs are sufficient.
- Your essay, 233 words, is way too long.
- Aim for 170-190 words for Task 1.
- Three paragraphs are sufficient.
- You have quite a few spelling mistakes.
- ) continents, namely Asia and Europe and United States (The US is not a continent) in terms of the expenditure on five different types of recreational acitivities between 1995 and 200 0 .
Get the Weekly English Kit 📬
New words, one handy idiom, and a 2-minute quiz — delivered to your inbox to keep your streak alive.
Your essay, 233 words, is way too long. Aim for 170-190 words for Task 1.
Three paragraphs are sufficient.
You have quite a few spelling mistakes.
The stacked bar chart compares two (Two?) continents, namely Asia and Europe and United States (The US is not a continent)
 Related Questions