
Please review my Task 1 essay
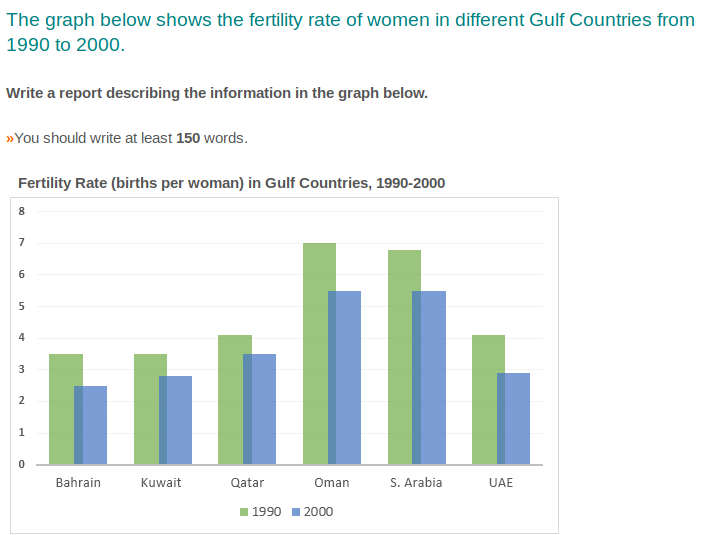
The bar graph depicts the average births per women in six countries in the Gulf region between 1990 and 2000.
Overall, in all gulf nations, the fertility rate decreased over the given period. Whereas Oman and Saudi Arabia registered the highest births per woman, Bahrain and Kuwait had the lowest.
In 1990, Oman accounted for the highest fertility rate with 7 births per women. This was followed by Saudi Arabia with a fertility rate of slightly below that of Oman. After 10 years, both countries' fertility rate fell by around 20% to just over 5 births per women, which was stil the highest among gulf countries in that year.
Regarding the fertility rate of the rest of gulf countries, Qatar and UAE had similar values at around 4 births per women, while Bahrain and Kuwait had about 3.5. By the year 2000, the fertility rates in these countries declined by approximately 15% to ranging within 2 to 3.5 births per women.
Top answer
The bar graph (wrong word) depicts the average number of births per women (wrong form) in six countries in the Gulf region between (wrong word) 1990 and 2000. (Incomplete. " 1.
- The bar graph (wrong word) depicts the average number of births per women (wrong form) in six countries in the Gulf region between (wrong word) 1990 and 2000.
- (Incomplete.
- " 1.
- The line graph plots / shows / presents / depicts / gives the population of Rwanda between 1990 and 2000.
- (Between X and Y - a continuous line from X to Y.
Get the Weekly English Kit 📬
New words, one handy idiom, and a 2-minute quiz — delivered to your inbox to keep your streak alive.
The bar graph (wrong word) depicts the average number of births per women (wrong form) in six countries in the Gulf region between (wrong word) 1990 and 2000. (Incomplete. What are these s
 Related Questions