
Please review my Task 1 essay.
Thank you very much
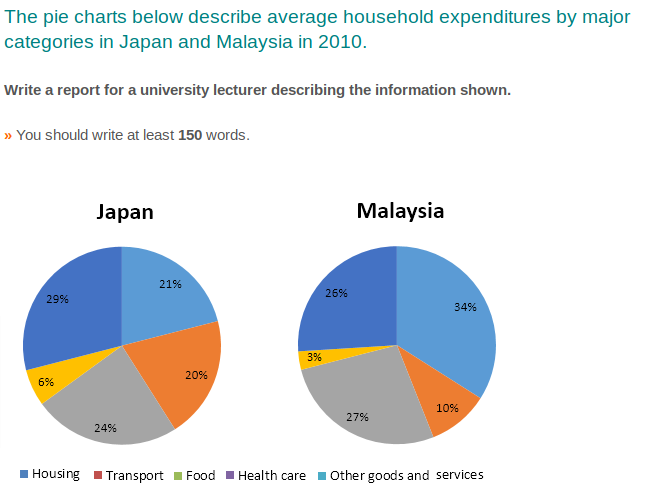
The pie charts depict the spending of an average household on housing, transport, food, health care and other goods and services in two countries (Japan and Malaysia) in the year 2010.
Overall, the Japanese spent the most on other goods and services, while for Malaysians, it was on housing. In both countries, health care accounted for the lowest outlay in the given period.
In Japan, other goods and services comprised 29% of the total average household expenditure, while the outlays for housing, transportation and food were relatively similar ranging between 20% and 24%. On the other hand, the Japanese spent only about 6% on health care.
Regarding the total household expenditure in Malaysia, housing took the highest portion with approximately one-third of the total household spending. This was followed by food with 27% and other goods and services with 26%. Interestingly, the outlays for transport and health care were about half of those of Japan with 10% and 3%, respectively.
Top answer
jasondecastro Regarding the total household expenditure in Malaysia, housing took accounted for the highest portion proportion with approximately one-third of the total household spending. This was followed by food with 27% and other goods and services with 26%. Interestingly, the outlays for transport and health care were about half of those of Japan with 10% and 3%, respectively.
- jasondecastro Regarding the total household expenditure in Malaysia, housing took accounted for the highest portion proportion with approximately one-third of the total household spending.
- This was followed by food with 27% and other goods and services with 26%.
- Interestingly, the outlays for transport and health care were about half of those of Japan with 10% and 3%, respectively.
Get the Weekly English Kit 📬
New words, one handy idiom, and a 2-minute quiz — delivered to your inbox to keep your streak alive.
jasondecastroRegarding the
totalhousehold expenditure in Malaysia, housingtookaccounted for the highestportionproportion with approximately one-third of the total household spending. This was followed by food with 27% and other goods and services
 Related Questions