
Please review my task 1
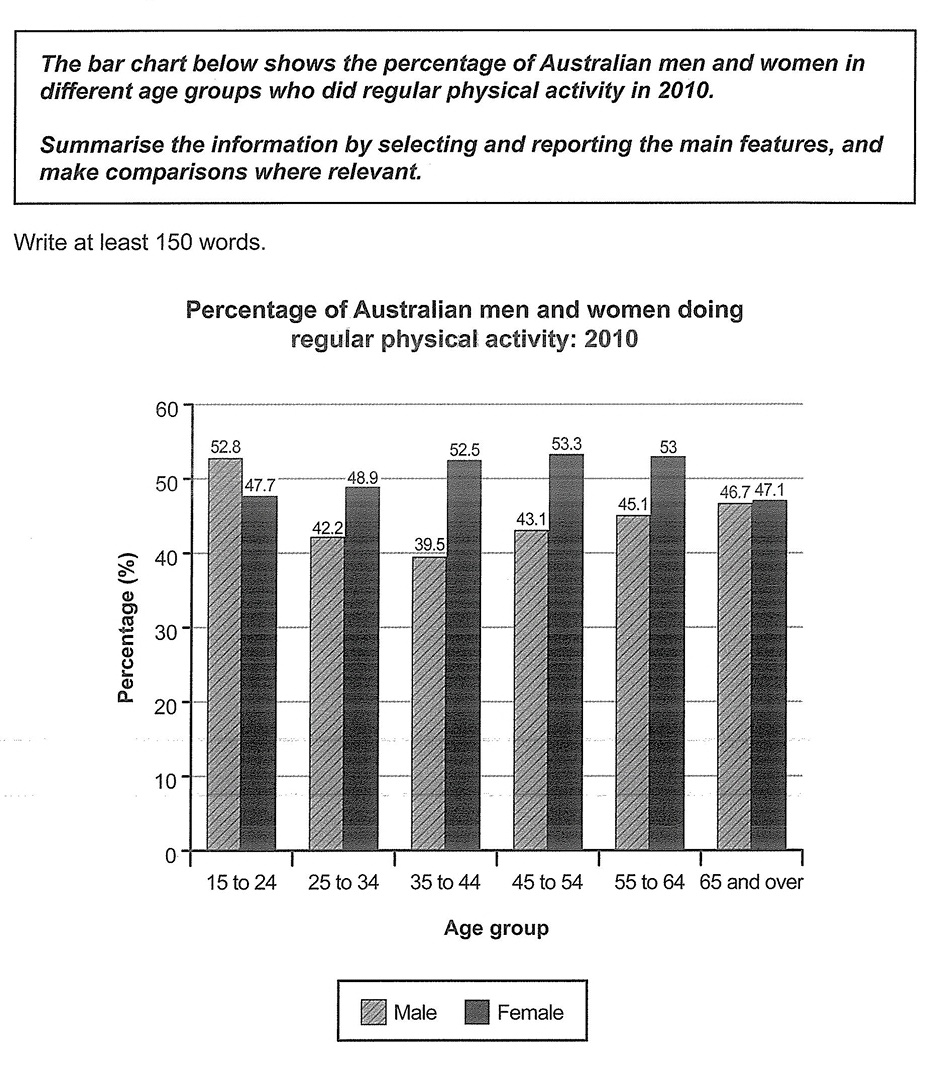
The bar graph compares the number of Australian males and females from different age groups who took part in routine physical activity in the year 2010. Overall, it is clear to see that females from all age groups were more active than males, except 15 to 24 age group, where the opposite was true. Additionally, males from the age bracket of 35 to 44 years were least active among all categories.
Roughly, a majority of females exercised regularly in 2010. The figures for females taking part in regular exercise were 52.5 to 53.3% from 35 to 64 age group whereas 47.1 to 48.9% from 15 to 34 and seniors age bracket. Turning to the males, the only age group where males were more active than females was 15 to 24 where around 5% more males exercised regularly. Only 39.5% of men between the years of 35 to 44 did some physical activity, this percentage increased with age, and finally, 46.7% of males in 64 and over age category took part in activity.
Top answer
The bar graph compares the number proportions of Australian males and females from different age groups who took part in routine physical activity in the year 2010. [ 1] Overall, it is clear to see that females from all age groups were more active than males, except for the 15 to 24 age group, where the opposite was true. Additionally, males from the age d bracket of 35 to 44 years were the least active in the entire chart.
- The bar graph compares the number proportions of Australian males and females from different age groups who took part in routine physical activity in the year 2010.
- [ 1] Overall, it is clear to see that females from all age groups were more active than males, except for the 15 to 24 age group, where the opposite was true.
- Additionally, males from the age d bracket of 35 to 44 years were the least active in the entire chart.
- among all categories.
- [ 2] -------------------------------------- [ 1]: Separate your introductory statement from the overall one.
Get the Weekly English Kit 📬
New words, one handy idiom, and a 2-minute quiz — delivered to your inbox to keep your streak alive.
The bar graph compares the number proportions of Australian males and females from different age groups who took part in routine physical activity in the year 2010.
[ 1]
Overall, it is clear to see that females from all age groups were more active than males, except for the 15 to
 Related Questions