
Please, review my Task 1
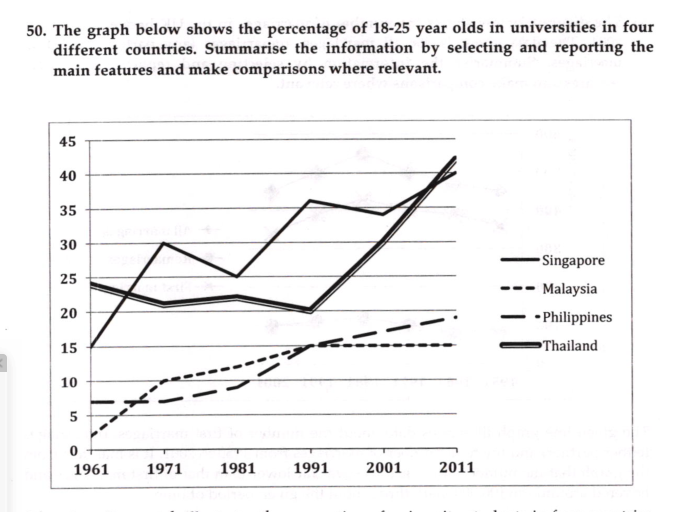
The line graph shows the proportion of students aged 18-25 studying in the universities of Singapore, Malaysia, Philippines and Thailand from 1961 and 2011.
On balance, the percentage of students attending to tertiary education in all four South-east Asian countries increased over six decades with Thailand and Singapore accounting for the significant majority.
In details, the percentage of Thai students decreased from 25% in 1961 to 20% in 1991, however, this was followed by a dramatic increase and they doubled their attendance as high as 42% in 2011. Similarly, 15% of students in Singapore were going to universities and their percentage grew markedly and reached 40% by 2011 despite having fluctuations in 1981 and 2011 when the numbers dropped to 25% and 35% correspondingly.
Meanwhile, about 2% of Malaysian and 7% Filipino students studied for a degree in 1961 and their percentages equalled to 15% in 1991. After that, the former group levelled off in their proportion, whereas, the latter grew steadily to reach to almost 20% at the end of the period.
Top answer
You did not understand this line graph. The line graph shows the proportion of students aged 18-25 studying in the universities of Singapore, Malaysia, Philippines and Thailand from 1961 and 2011. Not so good.
- You did not understand this line graph.
- The line graph shows the proportion of students aged 18-25 studying in the universities of Singapore, Malaysia, Philippines and Thailand from 1961 and 2011.
- Not so good.
- It is important to understand that the line graph shows the percent of the youth population in those countries, not that the universities were in those countries.
- The line graph shows the proportion the young adult population (people aged 18-25) in each of four countries who were students studying in universities.
Get the Weekly English Kit 📬
New words, one handy idiom, and a 2-minute quiz — delivered to your inbox to keep your streak alive.
You did not understand this line graph.
The line graph shows the proportion of students aged 18-25 studying in the universities of Singapore, Malaysia, Philippines and Thailand from 1961 and 2011.
Not so good.
It is important to understand that the line graph shows the percent of the youth population in those countries, not that the universities were in those c
 Related Questions