
Please review my IELTSl line graph essay thank you so much
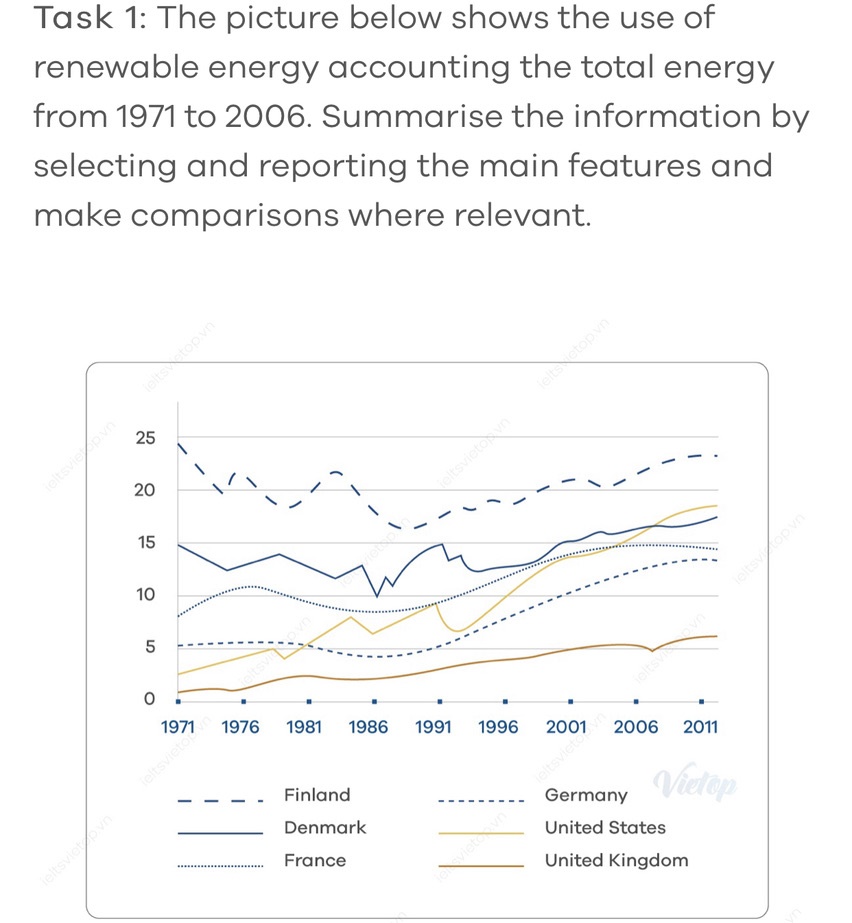
The line graph illustrates the consumption of renewable energy in six countries over the course of 35 years.
Overall, there was an increase in the energy usage of the UK, the US, Germany, Denmark and France, with the US witnessing the most dramatic rise, It is also clear that Finland consistantly had by far the highest figure throught out the period, though a considerable decrease was seen in the middle of the period.
Just under 25% of the total energy was consumed on Finland in 1971, with a subsequent drop to nearly 17% between 1986 and 1991 and a final rise to roughly 23%. Similar changes was seen in the figures for Finland, France and Germany which drop simultaneously in 1986 before ending the period at 17%, 15% and 14% respectively.
the use of renewable resource in the US started at 3%, followed by a considerable increase to about 18%. Indentical changes, but to a lesser extent, was seen in the figure for the UK which increase steadily to 6% towards the end of the period
Top answer
Where did you find this task 1? The instructions are not good English. Use reputable sources for practice essays.
- Where did you find this task 1?
- The instructions are not good English.
- Use reputable sources for practice essays.
- Please read my advice for Task 1 essays: IELTS TASK 1: Hints, Tips And Advice Vocabulary Words For Task 1: Reference Post
Get the Weekly English Kit 📬
New words, one handy idiom, and a 2-minute quiz — delivered to your inbox to keep your streak alive.
Where did you find this task 1? The instructions are not good English. Use reputable sources for practice essays.
Please read my advice for Task 1 essays:
The line graph illustrates (Not a good word choice - read my advice.) the consumption (wrong word. The plot would show units of energy, e.g. BTU equivalents.) of renewable energy in six (Which countries?) countries over the
Overall, there was an increase in the energy usage (Maybe that is true, but that is NOT what is plotted on the graph.) of the UK, the US, Germany, Denmark and France, with the US witnessing (Poor word choice; read my advice.)the most dramatic rise, It is also clear that (Us
Just under 25% of the total energy (Incorrect. What other country used the remaining 75%?) was consumed on (wrong word) Finland in 1971, (Where is 1971 in the period? You never wrote the years of the period.) with a subsequent drop to
 Related Questions