
Please review my IELTS writing taske 1 (pie chart)
Hello,
It took a quite long time for me to finish this IELTS writing task 1 with pie charts. Please review it for me!
Thank you very much!
The following is my essay:
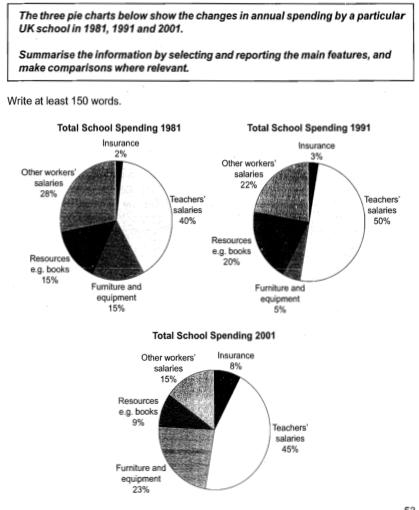
The three pie charts compare the proportions of expense in a year of an UK school in five categories including teachers’ salaries, furniture and equipment, resources, other workers’ salaries and insurance for three years 1981, 1991 and 2001.
Overall, the highest percentage of spending was for teachers’ salaries for all three years which accounted for nearly a half of the total, and the smallest one was for insurance. Also, the proportion of salaries for other workers decreased and that of insurance increased, while there were fluctuations in other categories.
In 1981, 40% of total spending was for teachers’ salaries. This number increased to 50% in 1991 and then dropped to 45% in 2001. Meanwhile, there was a fluctuation in the percentage of spending for furniture, in 1981 it was 15% but dropped 3 times to 5% in 1991, then this increased roughly 4 times in 2001 (23%). Similarly, the percentage of spending for resources increased by 5% from 1981 to 1991, but fell dramatically to 9% in 2001.
In contrast, the percentage of salaries for other workers decreased linearly from 28% to 15% in three years. Finally, insurance accounted for smallest proportion of spending in all three years but it increased with 2%, 3%, and 8% in 1981, 1991, and 2001 respectively.
Top answer
The three pie charts compare the proportions of expense in a year of an UK school in five categories including teachers’ salaries, furniture and equipment, resources, other workers’ salaries and insurance for three years 1981, 1991 and 2001. That is a good attempt. You need to be much clearer about associating a pie chart with a year.
- The three pie charts compare the proportions of expense in a year of an UK school in five categories including teachers’ salaries, furniture and equipment, resources, other workers’ salaries and insurance for three years 1981, 1991 and 2001.
- That is a good attempt.
- You need to be much clearer about associating a pie chart with a year.
- "Breakdown" means a classification into particular categories.
- It is a very good word to use for pie charts.
Get the Weekly English Kit 📬
New words, one handy idiom, and a 2-minute quiz — delivered to your inbox to keep your streak alive.
The three pie charts compare the proportions of expense in a year of an UK school in five categories including teachers’ salaries, furniture and equipment, resources, other workers’ salaries and insurance for three years 1981, 1991 and 2001.
That is a good attempt. You need to be much clearer about associating a pie chart with a year.
"Breakdown" means a classification into
 Related Questions