
Please review my IELTS Writing Task 1. Thanks a lot !
Subject: Price changes for fresh fruits and vegetables, sugars
and sweets, and carbonated drinks
The graph below shows relative price changes for fresh fruits and vegetables, sugars and sweets, and carbonated drinks between 1978 and 2009. Summarise the information by selecting and reporting the main features, and make comparisons where relevant.
The line graph illustrates the alterations of cost for three foodstuffs from 1979 to 2009 and the average of money spending over this period.
Overall, it is evident that the prices of all three products increased in spite of their fluctuations. However, according to the graph, only the amount of money paid for fresh fruits and vegetables was very higher than two others and the average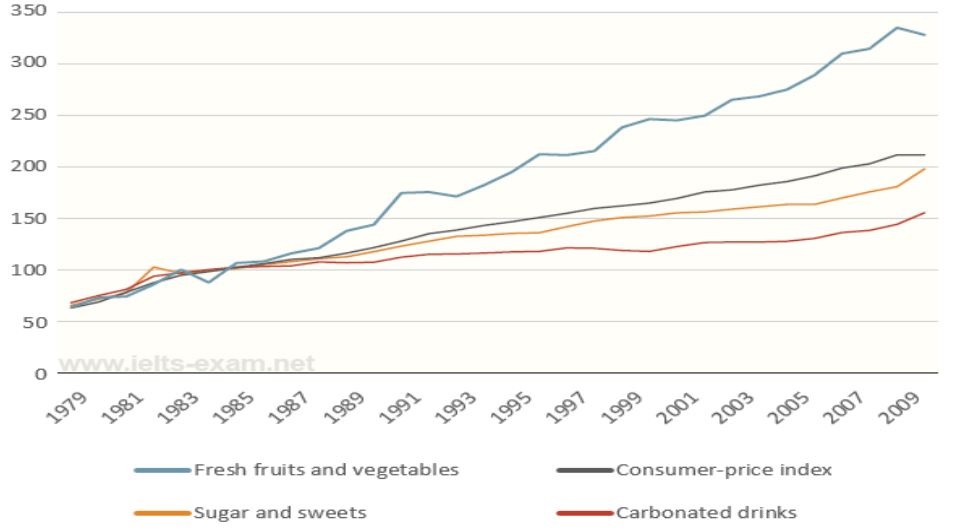
prices.
All three foodstuffs seem to have the same figure of 60 at the starting point. From 1979 to 1985, prices for carbonated drinks and sugar and sweets rose equally. But throughout the remainder of this period, the cost of sugar and sweets went up more sharply than carbonated drinks and peaked at 200 in 2019. Despite their increases, their prices were consistently below the consumer price index. Over 1979-2019 period, CPI increased steadily and reached a peak at around 210 in 2019.
In terms of fruits and vegetables, the number of money for this foodstuff rose more significantly over the period of 30 years. From the same starting point of about 60, it soared and finished at roughly 325.
Get the Weekly English Kit 📬
New words, one handy idiom, and a 2-minute quiz — delivered to your inbox to keep your streak alive.
 Related Questions