
Please review my IELTS writing task 1, thanks.
The chart below shows annual number of rentals and sales (in various formats) of films from a particular store between 2002 and 2011. Summarize the information by selecting and reporting the main features, and make comparisons where relevant.
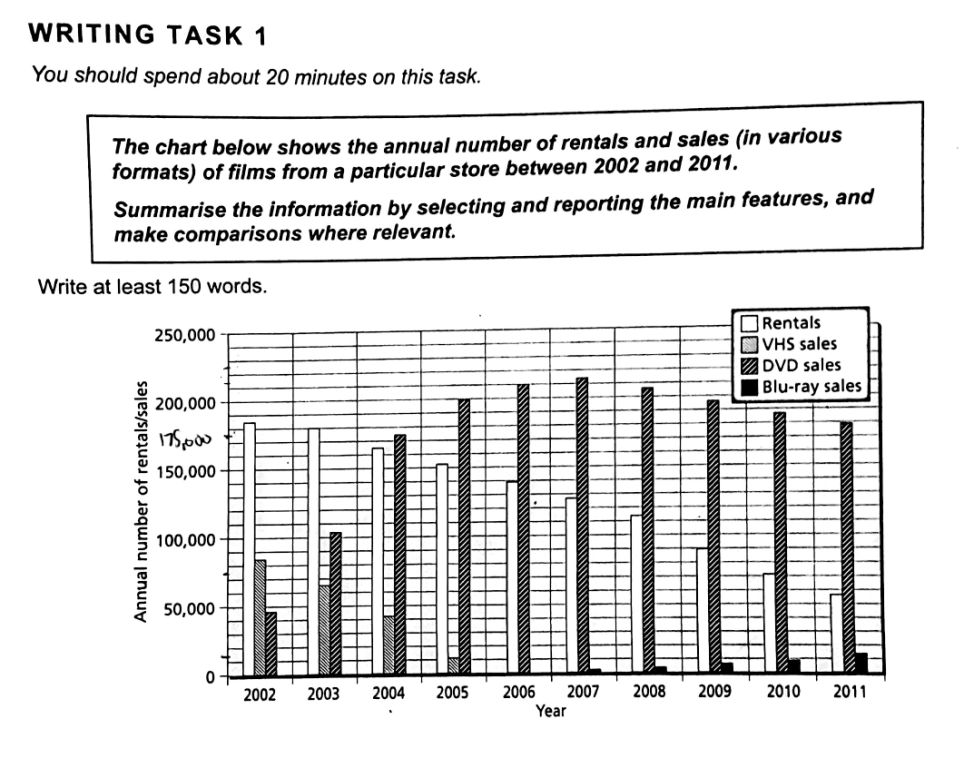
The grouped bar chart shows how many films were sold and rented every year from a certain store between 2002 and 2011. The sales are divided into three media types: VCD, DVD, and Blu-ray.
Overall, film rentals were in steady decline, as were VSH sales. Films in this format were no longer on sale from 2006 onwards. By comparison, there was a slow increase in the sales of Blu-ray films, which were introduced in 2007 when DVD sales happened to reach a peak.
In detail, VSH sales dropped from approximately 85,000 in 2002 to nil in 2006, while Blu-ray sales climbed from about 2,000 in 2007 to roughly 15,000 in 2011. Regarding DVD sales, while they were outnumbered by film rentals by approximately 185,000 to 48,000 in 2002, the situation began to be reversed in 2004, when about 175,000 DVDs were sold, compared with nearly 165,000 films rented. Thereafter, DVD sales rose to a high of roughly 215,000 in 2007 before falling back to 180,000 in 2012. By comparison, the number of films rented decreased at a relentless pace to 55,000 in 2012.
Top answer
The grouped bar chart shows how many films were sold and rented every year from a certain store between 2002 and 2011. ) DVD, and Blu-ray. Overall, film rentals were in steady decline, as were VSH sales.
- The grouped bar chart shows how many films were sold and rented every year from a certain store between 2002 and 2011.
- ) DVD, and Blu-ray.
- Overall, film rentals were in steady decline, as were VSH sales.
- Films in this format were no longer on sale from 2006 onwards.
- By comparison, there was a slow increase in the sales of Blu-ray films, which were introduced in 2007 when DVD sales happened to reach a peak.
Get the Weekly English Kit 📬
New words, one handy idiom, and a 2-minute quiz — delivered to your inbox to keep your streak alive.
The grouped bar chart shows how many films were sold and rented every year from a certain store between 2002 and 2011. The sales are divided into three media types: VCD, (Be sure to copy correctly.) DVD, and Blu-ray.
Overall, film rentals were in steady decline, as were VSH sales. Films i
Sample essay:
The bar chart plots the number of sales of films in three formats, VHS, DVD and Blu-ray, each year by one store between 2002 and 2011. Rentals of all types of films are also shown.
Overall, in 2002 the store did much more business in renting films than selling them, but by 2011 the business was dominated by sales. Transactions peaked in 2007, the first year that blu-r
 Related Questions