
Please review my IELTS writing task 1. Thank you!
(Sorry if the chart is hard to see clearly.)
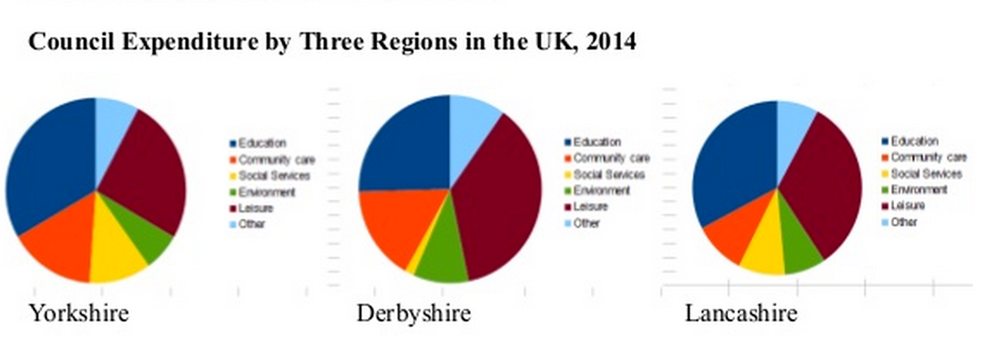
The pie charts compare the money spent on five categories: Education, Leisure, Environment, Community care, and Social services by three counties – Yorkshire, Derbyshire and Lancashire over a year period in 2014.
Overall, among the three counties, Education and Leisure were the two largest categories on which their expenditure was. In contrast, Environment, Community care and Social services accounted for rather small proportions.
Looking at the two highest expenses, Yorkshire and Lancashire councils spent approximately a third of their budget on Education, whereas Derbyshire council allocated a quarter of theirs to this sector. Regarding Leisure activity, Yorkshire council spent around 25%, whilst Lancashire and Derbyshire put slightly more, at about 27 and 33% respectively.
Turning to the other categories, the three counties allocated roughly between 10-15% of their total money to Environment. In terms of Community care, the expenditure of Yorkshire and Derbyshire was similar at around 20%, which was twice as much as that of Lancashire, 10%. With Social services, this only made up averagely between 10-12% of the total spending of Yorkshire and Lancashire councils, and a very small percentage of Derbyshire council’s. Approximately 10% of expenditure of the three regions was used for Other services.
Top answer
) pie charts compare the money spent on five categories: Education, Leisure, Environment, Community care, and Social services by three counties – Yorkshire, Derbyshire and Lancashire over a year period in 2014. Model paragraph: The three pie charts, labeled Yorkshire, Derbyshire and Lancashire, compare the money their councils spent on five categories: Education, Leisure, Environment, Community care, and Social services in 2014. Overall, among the three counties, Education and Leisure were the two largest categories of largest spending, taking more than 50% of the total.
- ) pie charts compare the money spent on five categories: Education, Leisure, Environment, Community care, and Social services by three counties – Yorkshire, Derbyshire and Lancashire over a year period in 2014.
- Model paragraph: The three pie charts, labeled Yorkshire, Derbyshire and Lancashire, compare the money their councils spent on five categories: Education, Leisure, Environment, Community care, and Social services in 2014.
- Overall, among the three counties, Education and Leisure were the two largest categories of largest spending, taking more than 50% of the total.
- on which their expenditure was .
- In contrast, Environment, Community care and Social services accounted for rather small proportions.
Get the Weekly English Kit 📬
New words, one handy idiom, and a 2-minute quiz — delivered to your inbox to keep your streak alive.
The (How many?) pie charts compare the money spent on five categories: Education, Leisure, Environment, Community care, and Social services by three counties – Yorkshire, Derbyshire and Lancashire over a year period in 2014.
Model paragraph:
The three pie charts, labeled Yorkshire, Derbyshire and Lancashire, compare the money their councils spent on
 Related Questions